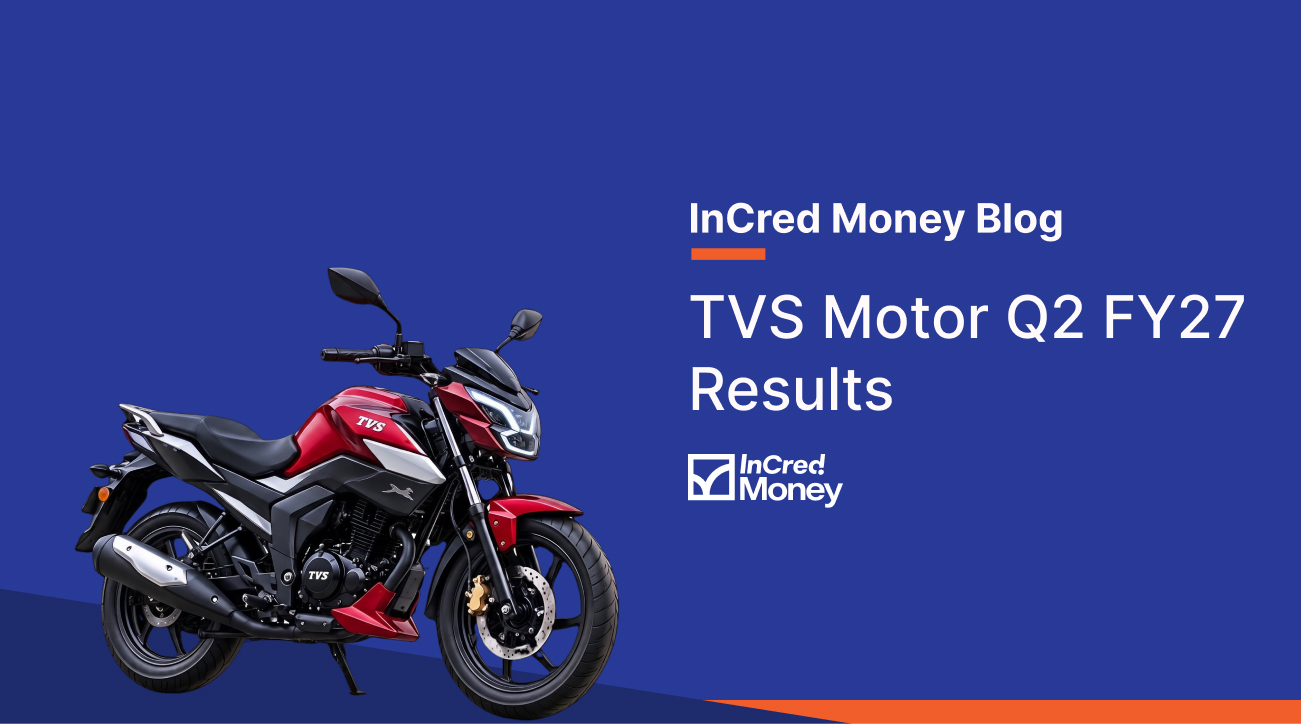
TVS Motor Company Limited reported consolidated revenue from operations of ₹19,474.44 crore in Q2 FY27, up 38.6% year on year (YoY). Consolidated profit after tax (PAT) stood at ₹1,219.45 crore, compared with ₹832.76 crore in Q2 FY26, an increase of 46.4%. The quarter ended on 30 September 2026, and the results were approved by the Board on 28 October 2026.
TVS Motor’s Q2 FY27 Earnings
| Financial Metric | Q2 FY27 | Q2 FY26 | YoY Change |
|---|---|---|---|
| Consolidated revenue from operations | ₹19,474.44 crore | ₹14,051.22 crore | +38.6% |
| Total income | ₹19,572.43 crore | ₹14,037.22 crore | +39.4% |
| Profit before tax (PBT) | ₹1,791.14 crore | ₹1,223.29 crore | +46.4% |
| Profit after tax (PAT) | ₹1,219.45 crore | ₹832.76 crore | +46.4% |
TVS Motor recorded growth in revenue and profitability compared with the corresponding quarter last year. Consolidated earnings per share (EPS) increased to ₹25.14 from ₹16.74 in Q2 FY26.
Segment Revenue & Business Metrics
| Operating Segment | Q2 FY27 Revenue and Other Income | YoY Change |
|---|---|---|
| Automotive | ₹17,529.54 crore | +42.7% |
| Financial | ₹2,052.07 crore | +16.9% |
The Automotive segment remained the larger contributor, with revenue and other income of ₹17,529.54 crore. The Financial segment recorded ₹2,052.07 crore. Segment figures include revenue and other income as reported by the company.
TVS Motor’s consolidated total assets stood at ₹66,870.69 crore as of 30 September 2026, compared with ₹56,500.62 crore as of 31 March 2026.
TVS Motor Share Price Reaction After Q2 FY27 Results
| Results Metric | Value |
|---|---|
| Results announcement date | 28 October 2026 |
| Consolidated revenue from operations | ₹19,474.44 crore |
| Revenue growth YoY | +38.6% |
| Profit before tax | ₹1,791.14 crore |
| Profit after tax | ₹1,219.45 crore |
| PAT growth YoY | +46.4% |
Investors may track revenue growth, segment performance, margins and the company’s acquisition and restructuring plans when assessing the results. Actual share price movements require separate market data.
TVS Motor vs Other Two-Wheeler Companies
| Company | Revenue / Total Income (Q2 FY27) | Revenue Growth YoY | PAT (Q2 FY27) | PAT Growth YoY |
|---|---|---|---|---|
| TVS Motor | ₹19,474.44 crore | +38.6% | ₹1,219.45 crore | +46.4% |
| Bajaj Auto | ₹25,125.56 crore | +59.7% | ₹3,436.10 crore | +61.9% |
| Hero MotoCorp | Results awaited | — | Results awaited | — |
Bajaj Auto reported higher consolidated revenue and PAT than TVS Motor in Q2 FY27, with year-on-year growth in both metrics. The comparison uses consolidated figures for both companies.
Disclaimer: This comparison is for informational and educational purposes only and is not investment advice. Figures are based on company disclosures and reports available as of 28 October 2026. Refer to official BSE/NSE filings for the latest and complete financials.
TVS Motor’s Quarterly Financial Performance
| Quarter | Revenue from Operations | Profit Before Tax | Profit After Tax | Revenue Growth YoY |
|---|---|---|---|---|
| Q2 FY27 | ₹19,474.44 crore | ₹1,791.14 crore | ₹1,219.45 crore | +38.6% |
| Q1 FY27 | ₹16,295.52 crore | ₹1,545.19 crore | ₹1,057.61 crore | — |
| Q2 FY26 | ₹14,051.22 crore | ₹1,223.29 crore | ₹832.76 crore | — |
Revenue from operations increased sequentially from Q1 FY27 to Q2 FY27. PBT and PAT also rose compared with the previous quarter. Year on year, revenue, PBT and PAT recorded growth.
Key Takeaways from TVS Motor Q2 FY27 Results
- Revenue from operations: ₹19,474.44 crore, up 38.6% YoY.
- PAT: ₹1,219.45 crore, up 46.4% YoY.
- PBT: ₹1,791.14 crore, up 46.4% YoY.
- Segment performance: Automotive revenue and other income stood at ₹17,529.54 crore, while the Financial segment recorded ₹2,052.07 crore.
- STPL acquisition: The Board approved the acquisition of the entire stake in STPL Trading and Services Private Limited for ₹530.08 crore. On completion, STPL will become a wholly owned subsidiary.
- Composite scheme: The Board approved a scheme involving the amalgamation of TVS Motor Services Limited with TVS Motor Company and the demerger of a defined undertaking into Harita ARC Limited, subject to applicable approvals.
- Key metrics to track: Segment revenue, profitability, margins, acquisition completion and the proposed restructuring.
Disclaimer
The information provided above is for informational and educational purposes only and should not be construed as investment advice, a recommendation to buy or sell shares, or a guarantee of future performance. The financial results, operational metrics, share price data and industry comparisons are based on information available as of October 2026 and may be subject to revisions or updates. Investors should refer to official company disclosures and stock exchange filings for the latest information.