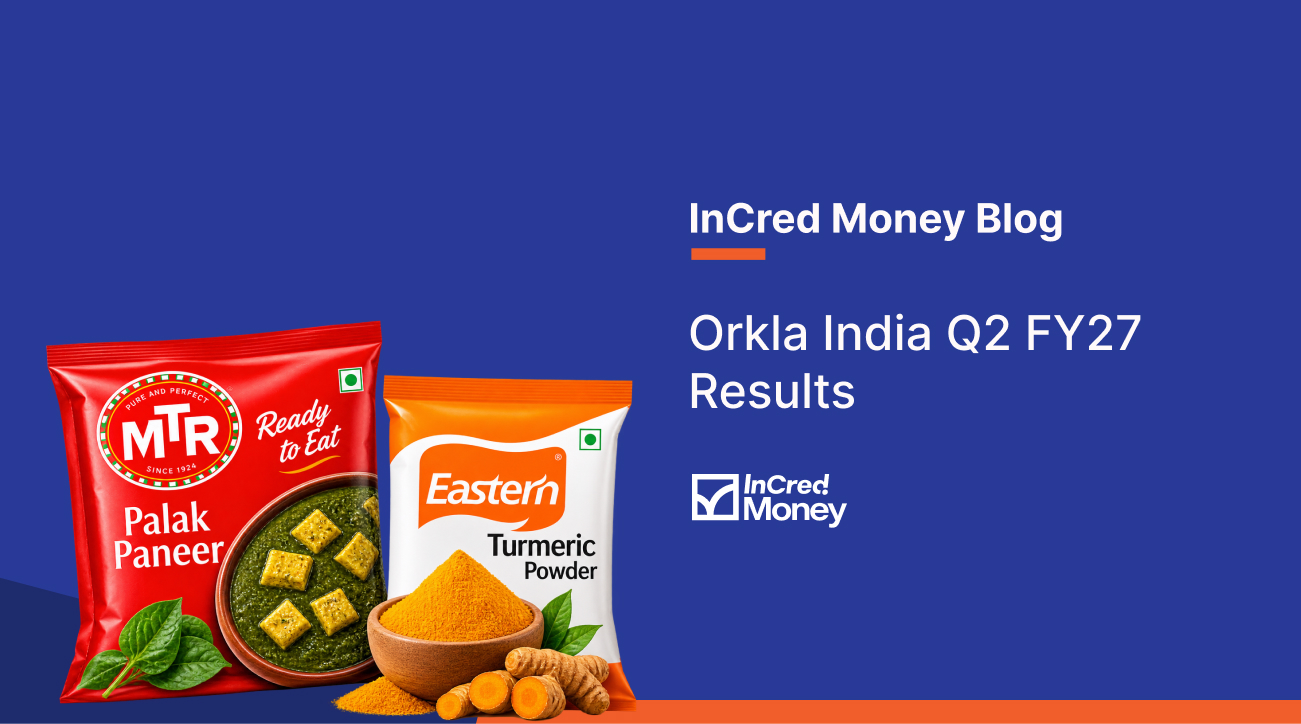
Orkla India reported consolidated revenue from operations of ₹776.16 crore in Q2 FY27, up 19.4% year on year (YoY). Profit after tax (PAT) increased 19.2% to ₹91.42 crore, while profit before tax rose 19.6% to ₹122.37 crore. The quarter ended on 30 September 2026.
Orkla India’s Q2 FY27 Earnings
| Financial Metric | Q2 FY27 | Q2 FY26 | YoY Change |
|---|---|---|---|
| Consolidated revenue from operations | ₹776.16 crore | ₹650.28 crore | +19.4% |
| Consolidated total income | ₹787.07 crore | ₹660.73 crore | +19.1% |
| EBITDA | ₹122.48 crore | ₹102.45 crore | +19.6% |
| EBITDA margin | 15.8% | 15.8% | Broadly flat |
| Profit before tax | ₹122.37 crore | ₹102.23 crore | +19.6% |
| Profit after tax (PAT) | ₹91.42 crore | ₹76.68 crore | +19.2% |
| Basic EPS | ₹6.70 | ₹5.60 | +19.6% |
Orkla India’s consolidated revenue and PAT increased strongly year on year, supported by growth across its food products and beverages business. The EBITDA margin remained broadly stable at 15.8%, indicating effective cost management despite input-cost pressures.
The company reported no exceptional items in Q2 FY27, compared with nil in the year-ago quarter. The profit before tax of ₹122.37 crore included a share of loss of ₹0.11 crore from an associate and joint venture.
Business Performance & Key Metrics
| Business / Operating Metric | Q2 FY27 | Previous Year / Period |
|---|---|---|
| Business segment | Food products and beverages | Single operating segment |
| Cost of raw materials and packing materials | ₹364.32 crore | ₹286.52 crore; +27.2% YoY |
| Purchase of stock-in-trade | ₹123.58 crore | ₹75.53 crore; +63.6% YoY |
| Employee benefits expense | ₹66.23 crore | ₹64.87 crore; +2.1% YoY |
| Other expenses | ₹137.93 crore | ₹117.34 crore; +17.6% YoY |
| Cash and cash equivalents | ₹30.81 crore | ₹22.89 crore as of 31 March 2026 |
Orkla India operates through three business units—MTR, Eastern and the International Business—focused on Indian food and beverage products. The company’s consolidated results include one subsidiary, one associate and one joint venture.
Cost of raw materials and packing materials rose 27.2% YoY to ₹364.32 crore, while purchases of stock-in-trade increased 63.6% YoY. However, higher revenue and operating leverage helped maintain stable EBITDA margins.
Share Price Reaction After Q2 FY27 Results
| Results Metric | Value |
|---|---|
| Results announcement date | 4 November 2026 |
| Market reaction | To be assessed after trading and management commentary |
| Consolidated PAT | ₹91.42 crore |
| PAT growth YoY | +19.2% |
| Revenue growth YoY | +19.4% |
| EBITDA margin | 15.8% |
The market response will reflect Orkla India’s strong revenue and profit growth, stable margins and continued momentum in its food and beverage business. Investors will track volume growth, input costs, brand performance and international expansion in the coming quarters.
Orkla India vs Other FMCG Stocks
| Company | Revenue from Operations (Q2 FY27) | Revenue Growth YoY | PAT (Q2 FY27) | PAT Growth YoY |
|---|---|---|---|---|
| Orkla India | ₹776.16 crore | +19.4% | ₹91.42 crore | +19.2% |
| Dabur India | ₹3,563.07 crore | +11.7% | ₹505.50 crore | +11.7% |
| Marico | Results awaited | — | Results awaited | — |
| Godrej Consumer Products | Results awaited | — | Results awaited | — |
Orkla India’s revenue growth of 19.4% was higher than Dabur India’s 11.7%, while its PAT growth of 19.2% was also stronger than Dabur’s 11.7%. Both companies maintained relatively stable margins despite input-cost pressures.
Marico and Godrej Consumer Products had not released their Q2 FY27 results at the time of writing. Their figures should be added after their official quarterly results and BSE/NSE filings are published.
Orkla India’s Quarterly Financial Performance
| Quarter | Revenue from Operations | EBITDA | PAT | Revenue Growth |
|---|---|---|---|---|
| Q2 FY27 | ₹776.16 crore | ₹122.48 crore | ₹91.42 crore | +19.4% YoY |
| Q1 FY27 | ₹659.10 crore | ₹115.84 crore | ₹87.70 crore | — |
| Q2 FY26 | ₹650.28 crore | ₹102.45 crore | ₹76.68 crore | — |
| H1 FY27 | ₹1,435.26 crore | ₹238.32 crore | ₹179.12 crore | +15.1% YoY |
Orkla India reported sequential improvement in revenue, EBITDA and PAT in Q2 FY27 compared with Q1 FY27. For the first half of FY27, consolidated revenue rose 15.1% YoY to ₹1,435.26 crore, while PAT increased 15.1% to ₹179.12 crore.
Key Takeaways from Orkla India Q2 FY27 Results
- Consolidated revenue from operations: ₹776.16 crore, up 19.4% YoY.
- EBITDA: ₹122.48 crore, up 19.6% YoY; EBITDA margin at 15.8%.
- PAT: ₹91.42 crore, up 19.2% YoY.
- Business segment: Food products and beverages, with operations through MTR, Eastern and International Business.
- Cost of raw materials: ₹364.32 crore, up 27.2% YoY.
- Key metrics to track: Volume growth, input costs, gross margin, brand performance, international expansion and working-capital cycle.
Disclaimer
The information provided above is for informational and educational purposes only and should not be construed as investment advice, a recommendation to buy or sell Orkla India shares, or a guarantee of future performance. The financial results, operational metrics and industry comparisons are based on Orkla India’s official unaudited consolidated financial results for the quarter ended 30 September 2026 and may be subject to revisions or updates. Investors should refer to Orkla India’s official disclosures and BSE/NSE filings for the latest information.