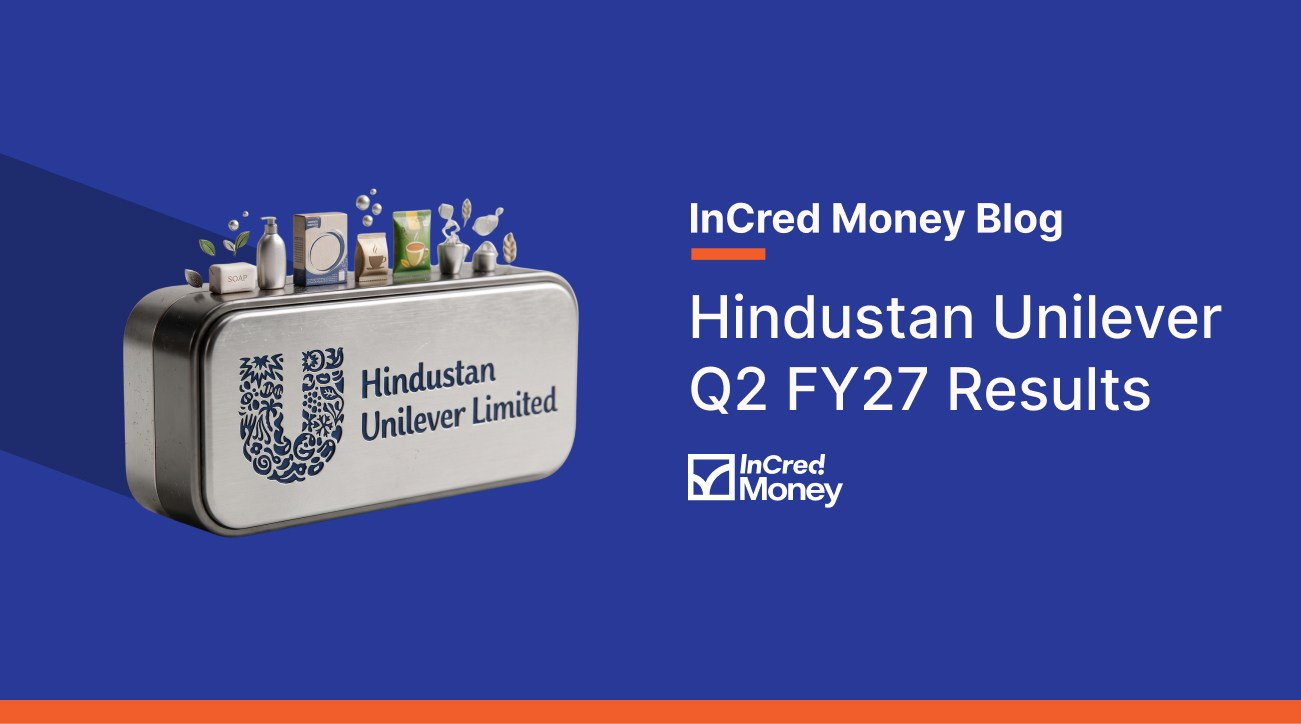
Hindustan Unilever (HUL) reported consolidated revenue from operations of ₹18,037 crore in Q2 FY27, up 14.8% year on year (YoY). Profit after tax (PAT) attributable to owners of the parent increased 3.9% to ₹2,790 crore, while underlying volume growth (UVG) stood at 7%. The quarter ended on 30 September 2026.
HUL’s Q2 FY27 Earnings
| Financial Metric | Q2 FY27 | Q2 FY26 | YoY Change |
|---|---|---|---|
| Turnover | ₹18,071 crore | ₹15,742 crore | +14.8% |
| Revenue from operations | ₹18,037 crore | ₹15,734.74 crore | +14.8% |
| EBITDA | ₹3,900 crore | ₹3,581 crore | +8.9% |
| EBITDA margin | 22.6% | 24.0% | -140 basis points |
| Profit after tax (PAT) attributable to owners | ₹2,790 crore | ₹2,685 crore | +3.9% |
| PAT before exceptional items | — | — | +9% |
HUL delivered its highest underlying sales growth in 14 quarters at 15%, with turnover of ₹18,071 crore. However, EBITDA margin declined 140 basis points to 22.6%, reflecting commodity-cost pressure.
Reported PAT growth was constrained by a one-off tax-related gain of ₹273 crore in the year-ago base period; PAT before exceptional items grew 9% YoY.
Business Performance & Key Metrics
| Operating Metric | Q2 FY27 | Previous Year / Period |
|---|---|---|
| Underlying sales growth (USG) | 15% | Highest in 14 quarters |
| Underlying volume growth (UVG) | 7% | Volume-led growth |
| Advertising and promotion spend | ₹3,138 crore | +13% YoY |
| Interim dividend | ₹19 per share | Declared with Q2 FY27 results |
| H1 FY27 turnover | ₹35,255 crore | — |
| H1 FY27 USG | 12% | — |
| H1 FY27 UVG | 6% | — |
HUL’s 7% underlying volume growth indicates demand was supported by volume rather than pricing alone. The company increased advertising and promotion spend by more than 13% YoY to ₹3,138 crore, while declaring an interim dividend of ₹19 per share.
For the first half of FY27, HUL recorded turnover of ₹35,255 crore, with underlying sales growth of 12% and underlying volume growth of 6%.
Share Price Reaction After Q2 FY27 Results
| Results Metric | Value |
|---|---|
| Results announcement date | 28 October 2026 |
| Market reaction | Shares slipped about 3% after results |
| Consolidated PAT | ₹2,790 crore |
| PAT growth YoY | +3.9% |
| Revenue growth YoY | +14.8% |
| EBITDA margin | 22.6%, down 140 basis points YoY |
The market reaction reflected margin pressure despite strong sales and volume growth. Investors will track commodity costs, pricing actions, volume momentum and margin recovery while assessing HUL’s outlook.
HUL vs Other FMCG Stocks
| Company | Revenue / Turnover (Q2 FY27) | Revenue Growth YoY | PAT (Q2 FY27) | PAT Growth YoY |
|---|---|---|---|---|
| Hindustan Unilever | ₹18,071 crore turnover | +14.8% | ₹2,790 crore | +3.9% |
| ITC | Results awaited | — | Results awaited | — |
| Nestlé India | Results awaited | — | Results awaited | — |
| Britannia Industries | Results awaited | — | Results awaited | — |
Disclaimer: Peer results for ITC, Nestlé India and Britannia Industries were not available in the official sources reviewed at the time of writing. FMCG comparisons should distinguish between turnover, revenue from operations and PAT, especially where exceptional items affect reported profit.
HUL’s Quarterly Financial Performance
| Quarter | Turnover | EBITDA | PAT Attributable to Owners | Underlying Volume Growth |
|---|---|---|---|---|
| Q2 FY27 | ₹18,071 crore | ₹3,900 crore | ₹2,790 crore | 7% |
| Q2 FY26 | ₹15,742 crore | ₹3,581 crore | ₹2,685 crore | — |
| H1 FY27 | ₹35,255 crore | — | — | 6% |
HUL reported strong sequential and year-on-year sales momentum in Q2 FY27. The quarterly comparison should consider the prior-year exceptional tax gain and commodity-cost impact on margins.
Key Takeaways from HUL Q2 FY27 Results
- Turnover: ₹18,071 crore, up 14.8% YoY.
- Revenue from operations: ₹18,037 crore, up 14.8% YoY.
- Underlying sales growth: 15%, the highest in 14 quarters.
- Underlying volume growth: 7%.
- EBITDA: ₹3,900 crore, up 8.9% YoY; EBITDA margin at 22.6%, down 140 basis points.
- PAT attributable to owners: ₹2,790 crore, up 3.9% YoY; PAT before exceptional items up 9%.
- Interim dividend: ₹19 per share.
- Key metrics to track: Commodity costs, pricing, volume growth, gross margins, advertising spend and competitive intensity.
Disclaimer
The information provided above is for informational and educational purposes only and should not be construed as investment advice, a recommendation to buy or sell shares, or a guarantee of future performance. The financial results, operational metrics, share price data and industry comparisons are based on information available as of October 2026 and may be subject to revisions or updates. Investors should refer to official company disclosures and stock exchange filings for the latest information.