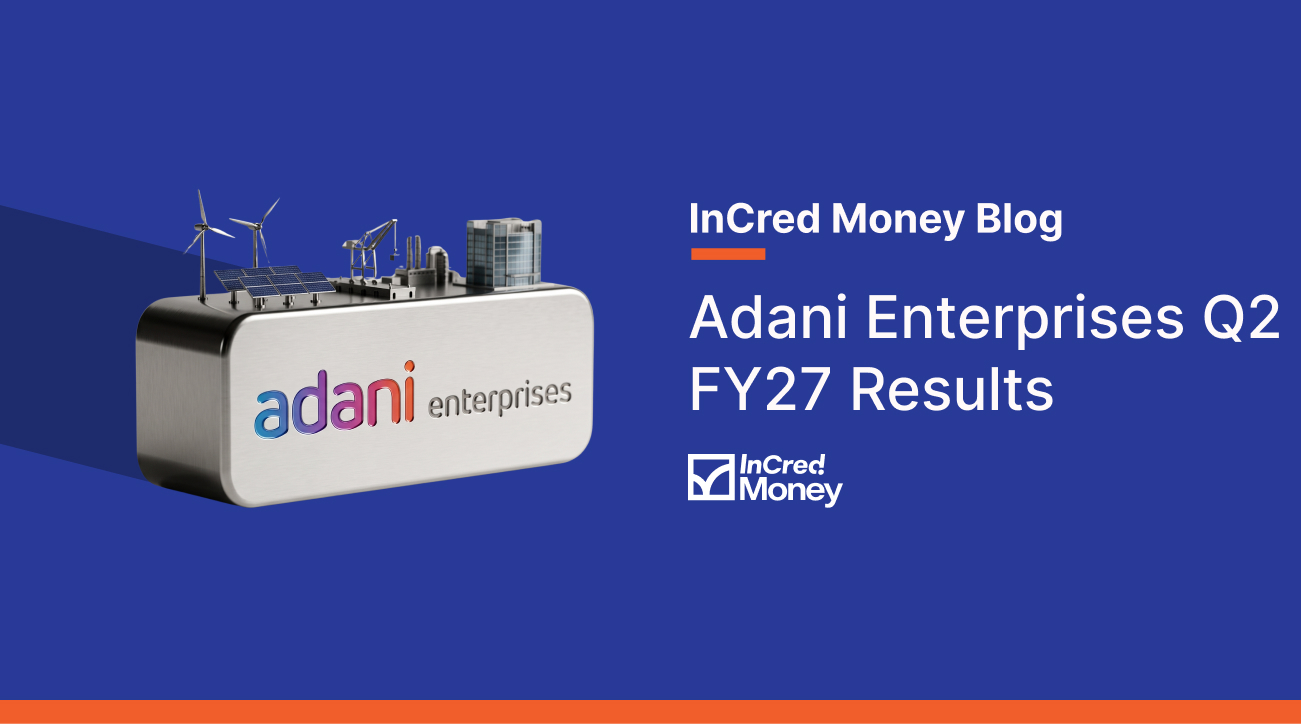
Adani Enterprises Limited reported consolidated revenue from operations of ₹37,215.62 crore in Q2 FY27, up 75.1% year on year (YoY). Profit after tax (PAT) stood at ₹1,220.99 crore, compared with ₹3,414.43 crore in Q2 FY26. The quarter ended on 30 September 2026, and the results were approved on 28 October 2026.
Adani Enterprises’ Q2 FY27 Earnings
| Financial Metric | Q2 FY27 | Q2 FY26 | YoY Change |
|---|---|---|---|
| Consolidated revenue from operations | ₹37,215.62 crore | ₹21,248.51 crore | +75.1% |
| Total income | ₹38,023.11 crore | ₹21,844.07 crore | +74.1% |
| Profit before tax (PBT) | ₹2,002.02 crore | ₹4,397.63 crore | -54.5% |
| Profit after tax (PAT) | ₹1,220.99 crore | ₹3,414.43 crore | -64.2% |
Revenue and total income increased year on year, while PBT and PAT declined. The previous year’s results included an exceptional gain of ₹3,583.28 crore, which is relevant when comparing profitability.
Segment Revenue & Business Metrics
| Operating Segment | Q2 FY27 Revenue | YoY Change |
|---|---|---|
| Integrated Resources Management | ₹7,096.99 crore | +6.6% |
| Commercial Mining | ₹2,489.46 crore | +45.4% |
| New Energy Ecosystem | ₹3,571.78 crore | +13.2% |
| Airport | ₹3,698.41 crore | +15.3% |
| Copper | ₹14,772.36 crore | +987.0% |
| Others | ₹4,286.98 crore | +36.2% |
Adani Enterprises’ Copper segment recorded revenue of ₹14,772.36 crore, while Integrated Resources Management contributed ₹7,096.99 crore. Commercial Mining and Airport revenue also increased year on year.
Total consolidated assets stood at ₹2,94,858.06 crore as of 30 September 2026, compared with ₹2,61,600.35 crore as of 31 March 2026.
Adani Enterprises Share Price Reaction After Q2 FY27 Results
| Results Metric | Value |
|---|---|
| Results announcement date | 28 October 2026 |
| Market reaction | 0.38% |
| Revenue from operations | ₹37,215.62 crore |
| Revenue growth YoY | +75.1% |
| Profit before tax | ₹2,002.02 crore |
| Profit after tax | ₹1,220.99 crore |
| PAT growth YoY | -64.2% |
Investors may track segment performance, exceptional items, borrowings and profitability when reviewing the results. Actual share price movements require separate market data.
Adani Enterprises vs Other Infrastructure and Diversified Companies
| Company | Revenue / Total Income (Q2 FY27) | Revenue Growth YoY | PAT (Q2 FY27) | PAT Growth YoY |
|---|---|---|---|---|
| Adani Enterprises | ₹37,215.62 crore | +75.1% | ₹1,220.99 crore | -64.2% |
| Larsen & Toubro | ₹78,750 crore (consolidated revenue from operations) | +16% | ₹5,202 crore (consolidated PAT) | +33% |
| Reliance Industries | Results awaited | — | Results awaited | — |
Disclaimer: This comparison is for informational and educational purposes only and is not investment advice. Figures are based on company disclosures and reports available as of 28 October 2026; refer to official BSE/NSE filings for the latest and complete financials.
Adani Enterprises’ Quarterly Financial Performance
| Quarter | Revenue from Operations | Profit Before Tax | Profit After Tax | Revenue Growth YoY |
|---|---|---|---|---|
| Q2 FY27 | ₹37,215.62 crore | ₹2,002.02 crore | ₹1,220.99 crore | +75.1% |
| Q1 FY27 | ₹32,923.98 crore | -₹1,369.38 crore | -₹1,461.54 crore | — |
| Q2 FY26 | ₹21,248.51 crore | ₹4,397.63 crore | ₹3,414.43 crore | — |
Revenue increased sequentially from Q1 FY27 to Q2 FY27, while PAT moved from a loss to a profit. Year on year, revenue rose, but PAT declined, partly reflecting the exceptional gain recorded in Q2 FY26.
Key Takeaways from Adani Enterprises Q2 FY27 Results
- Revenue from operations: ₹37,215.62 crore, up 75.1% YoY.
- PAT: ₹1,220.99 crore, down 64.2% YoY.
- PBT: ₹2,002.02 crore, down 54.5% YoY.
- Total assets: ₹2,94,858.06 crore as of 30 September 2026.
- QIP update: The company completed a qualified institutional placement worth ₹15,000 crore at ₹2,883 per share.
- Airport investment update: Adani Airport Holdings entered into an agreement for a potential investor stake of up to 5.54%, subject to applicable conditions and approvals.
- Key metrics to track: Segment revenue, exceptional items, borrowings and profitability.
Disclaimer
The information provided above is for informational and educational purposes only and should not be construed as investment advice, a recommendation to buy or sell shares, or a guarantee of future performance. The financial results, operational metrics, share price data and industry comparisons are based on information available as of October 2026 and may be subject to revisions or updates. Investors should refer to official company disclosures and stock exchange filings for the latest information.