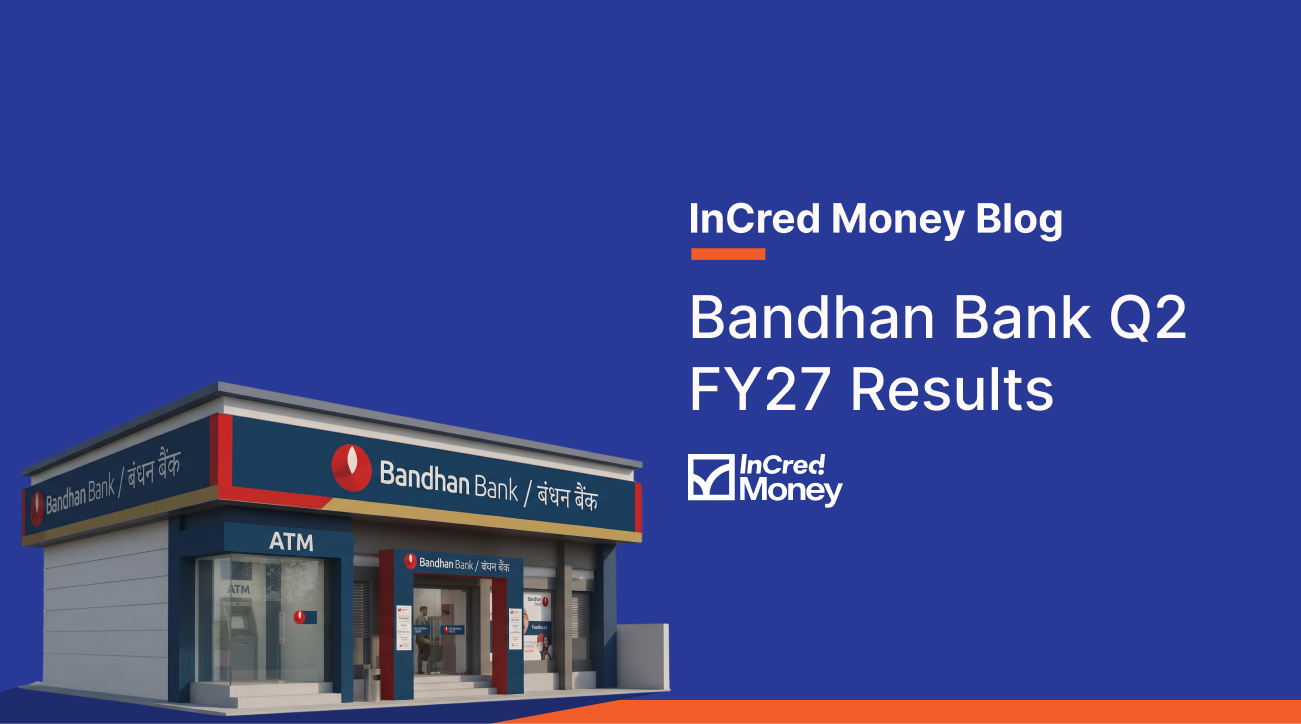
Bandhan Bank Q2 FY27 Results: Revenue, Profit, Segments & Key Updates
Bandhan Bank reported total income of ₹6,458.42 crore in Q2 FY27, registering a 9.4% YoY growth. Net profit stood at ₹621.75 crore, compared to ₹111.87 crore in Q2 FY26. The bank’s financial results for the quarter ended September 30, 2026, were approved by its Board of Directors on October 28, 2026.
Bandhan Bank’s Q2 FY27 Earnings
| Financial Metric | Q2 FY27 | Q2 FY26 | YoY Change |
|---|---|---|---|
| Total Income | ₹6,458.42 crore | ₹5,900.27 crore | +9.5% |
| Profit Before Tax (PBT) | ₹838.87 crore | ₹157.79 crore | +431.7% |
| Profit After Tax (PAT) | ₹621.75 crore | ₹111.87 crore | +455.6% |
Bandhan Bank’s total income increased during the quarter, while its net profit recorded a significant rise compared to the corresponding quarter of the previous financial year. Net interest income (NII) grew 14% YoY to ₹2,960 crore, while net total income increased 17% YoY to ₹3,665 crore. Operating profit stood at ₹1,556 crore, up 19% YoY.
Segment Revenue & Business Metrics
| Segment | Q2 FY27 Revenue |
|---|---|
| Treasury | ₹689.42 crore |
| Retail Banking | ₹5,619.40 crore |
| Wholesale Banking | ₹877.91 crore |
| Other Banking Operations | ₹155.51 crore |
| Total Segment Revenue | ₹7,342.24 crore |
| Less: Inter-segment Revenue | ₹883.82 crore |
| Income from Operations | ₹6,458.42 crore |
Retail Banking remained the largest contributor to segment revenue, followed by Wholesale Banking and Treasury. The bank’s total assets stood at ₹2,13,437.52 crore as of September 30, 2026, compared to ₹1,95,010.56 crore as of September 30, 2025.
Bandhan Bank Share Price Reaction After Q2 FY27 Results
Bandhan Bank announced its Q2 FY27 results on October 28, 2026. The supplied information does not include the bank’s share price movement following the announcement.
| Metric | Details |
|---|---|
| Results Announcement Date | October 28, 2026 |
| Market Reaction | +2.27% |
| Total Income | ₹6,458.42 crore |
| Total Income Growth | 9.5% YoY |
| PBT | ₹838.87 crore |
| PAT | ₹621.75 crore |
| PAT Growth | 455.6% YoY |
The bank reported improvement in profitability, supported by growth in net interest income and lower provisions and contingencies compared to the corresponding quarter of the previous year.
Bandhan Bank vs Other Private Sector Banks
| Company | Total Income (Q2 FY27) | Total Income Growth YoY | PAT (Q2 FY27) | PAT Growth YoY |
|---|---|---|---|---|
| Bandhan Bank | ₹6,458.42 crore | 9.5% | ₹621.75 crore | 455.6% |
| HDFC Bank | ₹97,267.62 crore | 6.8% | ₹19,509.96 crore | 4.7% |
| ICICI Bank | ₹57,157.49 crore | 15.9% | ₹14,843.03 crore | 20.1% |
| Axis Bank | ₹42,949.32 crore | 14.2% | ₹7,003.28 crore | 37.6% |
Disclaimer: The peer comparison is for informational purposes and does not account for differences in bank size, business mix or financial reporting basis.
Bandhan Bank’s Quarterly Financial Performance
| Financial Metric | Q2 FY27 | Q1 FY27 | Q2 FY26 |
|---|---|---|---|
| Total Income | ₹6,458.42 crore | ₹6,234.38 crore | ₹5,900.27 crore |
| Profit Before Tax (PBT) | ₹838.87 crore | ₹675.52 crore | ₹157.79 crore |
| Profit After Tax (PAT) | ₹621.75 crore | ₹501.67 crore | ₹111.87 crore |
| Total Income Growth YoY | 9.5% | — | — |
Bandhan Bank’s total income and net profit increased on a sequential basis compared to Q1 FY27. The bank also recorded higher income and profitability compared to Q2 FY26, with PAT increasing more than fivefold year-on-year.
Key Takeaways from Bandhan Bank Q2 FY27 Results
- Total income increased 9.5% YoY to ₹6,458.42 crore.
- Net profit rose to ₹621.75 crore from ₹111.87 crore in Q2 FY26.
- Net interest income grew 14% YoY to ₹2,960 crore.
- Net total income increased 17% YoY to ₹3,665 crore.
- Operating profit rose 19% YoY to ₹1,556 crore.
- Gross advances grew 13% YoY to ₹1.58 lakh crore.
- Total deposits increased 9% YoY to ₹1.73 lakh crore.
- Gross NPA ratio improved to 3.1% from 5.0% in Q2 FY26.
- Net NPA ratio declined to 0.9% from 1.4% in Q2 FY26.
- Capital adequacy ratio stood at 18.3%.
- The bank had 2,001 branches, 4,414 banking units and 438 ATMs as of September 30, 2026.
Disclaimer
The information provided above is for informational and educational purposes only and should not be construed as investment advice, a recommendation to buy or sell shares, or a guarantee of future performance. The financial results, operational metrics, share price data and industry comparisons are based on information available as of October 2026 and may be subject to revisions or updates. Investors should refer to official company disclosures and stock exchange filings for the latest information.