
In the last edition, we discussed how familiarity and TAM can deceive even sensible investors . Today, let’s look at three more myths, the kind that quietly enter our decision-making without us noticing.
While there are many more myths, these three in particular show up in many conversations about investing.
Myth #3: “High P/E is bad and low P/E is good.”
An investor once told me he bought a “cheap” PSU because the P/E looked irresistible. Six months later, the stock was down sharply. The P/E wasn’t low because the stock was undervalued; it was low because the business was struggling. The market already knew it.
That’s the problem with P/E. Without context, it misleads you badly. A low P/E can signal a bargain or a business in decline. A high P/E can indicate overvaluation or explosive earnings ahead. Without the full picture (growth, quality of earnings, industry dynamics) the ratio will almost always mislead you.
Here’s what you should keep in mind:
Growth Matters: A company growing earnings 20–25% annually deserves a higher P/E than one growing at 5%. That’s why many investors use the PEG ratio to tie valuation to growth.
Clean Earnings Matter: If EPS comes from one-offs, accounting adjustments, or tax reversals, the P/E becomes unreliable. If the “E” isn’t real, the P/E can’t be either.
Not Every High P/E is Expensive: A classic example is BSE. As shown in the graph, its profits grew nearly 6x in just two years, which is probably the reason why it traded at 100+ P/E in the past. Of course this is clear in hindsight, but it shows how incomplete the P/E ratio can be unless you understand the growth drivers.
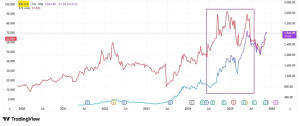
Note: The red line is the PE ratio and the blue line is the stock price.
Myth #4: “Always invest in a monopoly… at any price.”
Whenever someone asks me for “safe” long-term stock ideas, this line almost always enters the conversation: “I prefer monopolies. They can’t lose, right?”
I understand the comfort. A company with an 80% market share feels like a fortress. But in investing, even fortresses can crumble faster than you expect.
A monopoly is only valuable if three things stay intact: margins, pricing power, and competitive advantage. The moment any one of these weakens, dominance becomes a statistic, not a moat.
Think of telecom. For years, Airtel and Vodafone dominated India. They looked unbeatable. But when Jio entered the market, the economics of the entire sector changed almost overnight.
Or take Paints Companies. Asian Paints was the gold standard. Then Grasim arrived with deep pockets, and suddenly the conversations around pricing, margins, and moat strength shifted.
Myth #5: “GDP growth = stock market growth.”
This myth sounds logical until you actually look at the data.
India has seen periods where GDP grew steadily, but markets remained flat. And we’ve also seen the opposite — markets flying high even when GDP slowed.
Why does this happen? Because GDP and corporate profits don’t move in the same rhythm.
GDP includes everything: agriculture, government spending, small unlisted businesses, informal sectors, and industries that aren’t even represented on the stock market. But stock markets care only about the profitability of listed companies.
Imagine a year where agriculture booms, construction picks up, and government spending increases, GDP will rise. But none of this necessarily shows up in the profits of Nifty companies.
Another example: From 2003 to 2008, India’s markets went through one of the strongest bull runs ever. But the real driver wasn’t GDP, it was the explosion in corporate profits as a percentage of GDP. Companies were earning more per rupee of economic activity. That’s what investors were celebrating.
Markets don’t move exclusively because GDP grows, it is never a sole reason. They move because earnings grow, valuations expand, and liquidity flows.
While India’s Nifty 50 has grown roughly in line with nominal GDP from 2000–2024, the same pattern doesn’t hold for China or the US — suggesting India’s case may simply be a coincidence, not a rule.
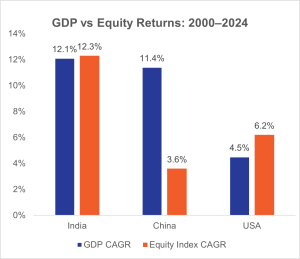
Note: Equity returns have been compared against nominal GDP growth. For equity indices, Nifty 50 has been used for India, SSE Composite for China, and S&P 500 for the United States. Source: World Bank, Google Finance
The Bottom Line
These myths are sticky because they sound so reasonable.
“Cheap means good.”
“Monopolies are safe.”
“GDP up, market up.”
In the markets, the simplest stories are often the most incomplete ones.
As we continue this series, we’ll unpack more such myths that quietly shape our decisions. My goal is simple: to help you think a little deeper than the obvious, because that’s where better investing truly begins.
If you missed the previous edition of the myth series, you can read it here.
If you enjoyed this newsletter, feel free to share it with your friends and family using the link below.
Also, if you have any topics that you would like us to cover or any other feedback, do write to us at connect@incredmoney.com
Till the next time,
Vijay
CEO – InCred Money