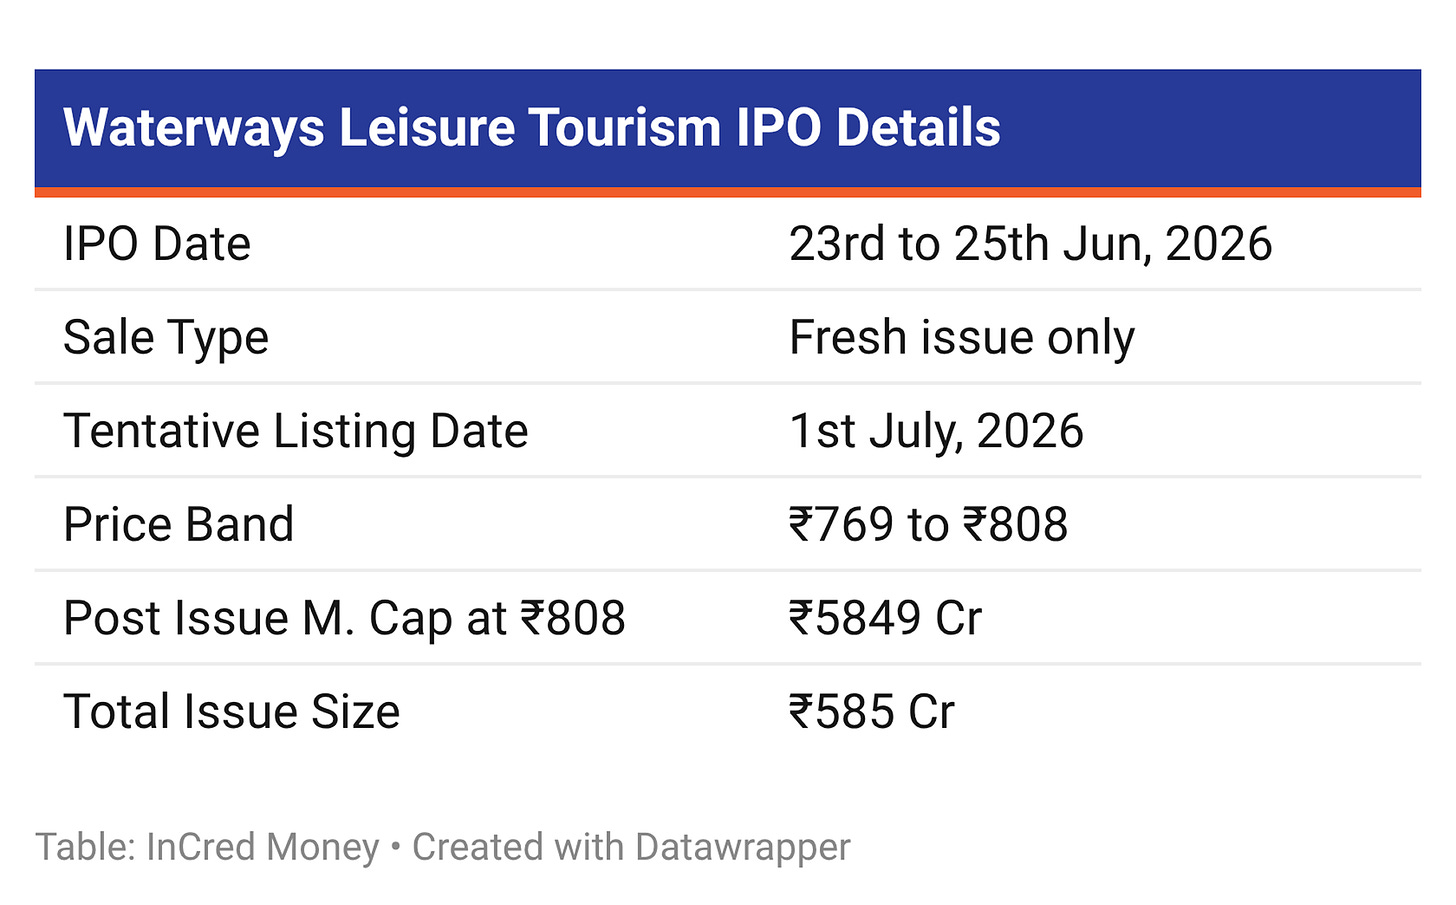
Waterways Leisure Tourism Limited (Cordelia Cruises), is filing a ₹585 Cr IPO on June 23, 2026. Cordelia has run a single 35 years old vessel, the MV Empress, since September 2021 and it controls ~79% of India’s overnight ocean cruise market by value.
IPO Summary
The Big Picture
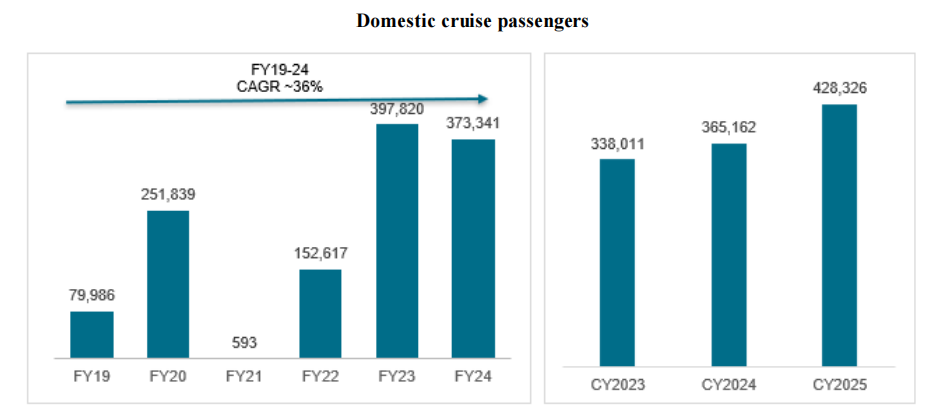
Domestic cruise passengers volume has been growing at a CAGR of 36% between FY2019 – FY2024 from 79,986 in FY2019 to 373,341 in FY2024.
(Source: RHP)
At the same time India’s cruise penetration sits at 0.01% of the population versus 5.7% in North America.
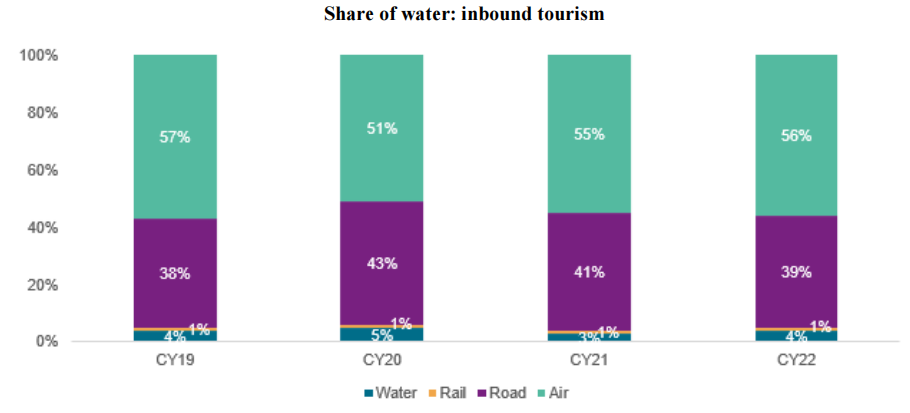
However globally share of water in inbound tourism remains relatively low!
(Source: RHP)
To support the industry the government has also introduced a Cruise Bharat Mission targeting to nearly double passenger traffic by 2029!
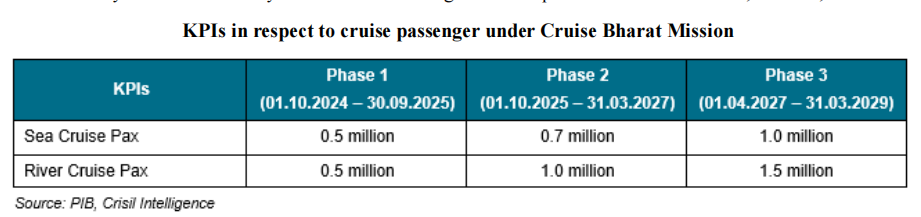
(Source: RHP)
FYI: Mumbai port had the highest share overall cruise passengers at 53% in Calendar Year 2025
Key growth factors of Indian cruise industry:
- Increasing Foreign travel
- Growth in domestic cruise passengers volumes
- Improvement in port infrastructure
- Sustained demand for premium and luxury travel
Business Model Explained
The company’s business model is built on pioneering the domestic ocean cruise market in India, where it holds a dominant 79% market share as of FY25.

Some of their domestic and international destinations include: Mumbai, Goa, Lakshadweep, Chennai, Phuket, Singapore, Malaysia!
Revenue streams
Revenue can be bifurcated into two major segments.
Cruise ticket sales contribute ~91% and onboard revenue contributes ~9% of total Revenue from Operations.
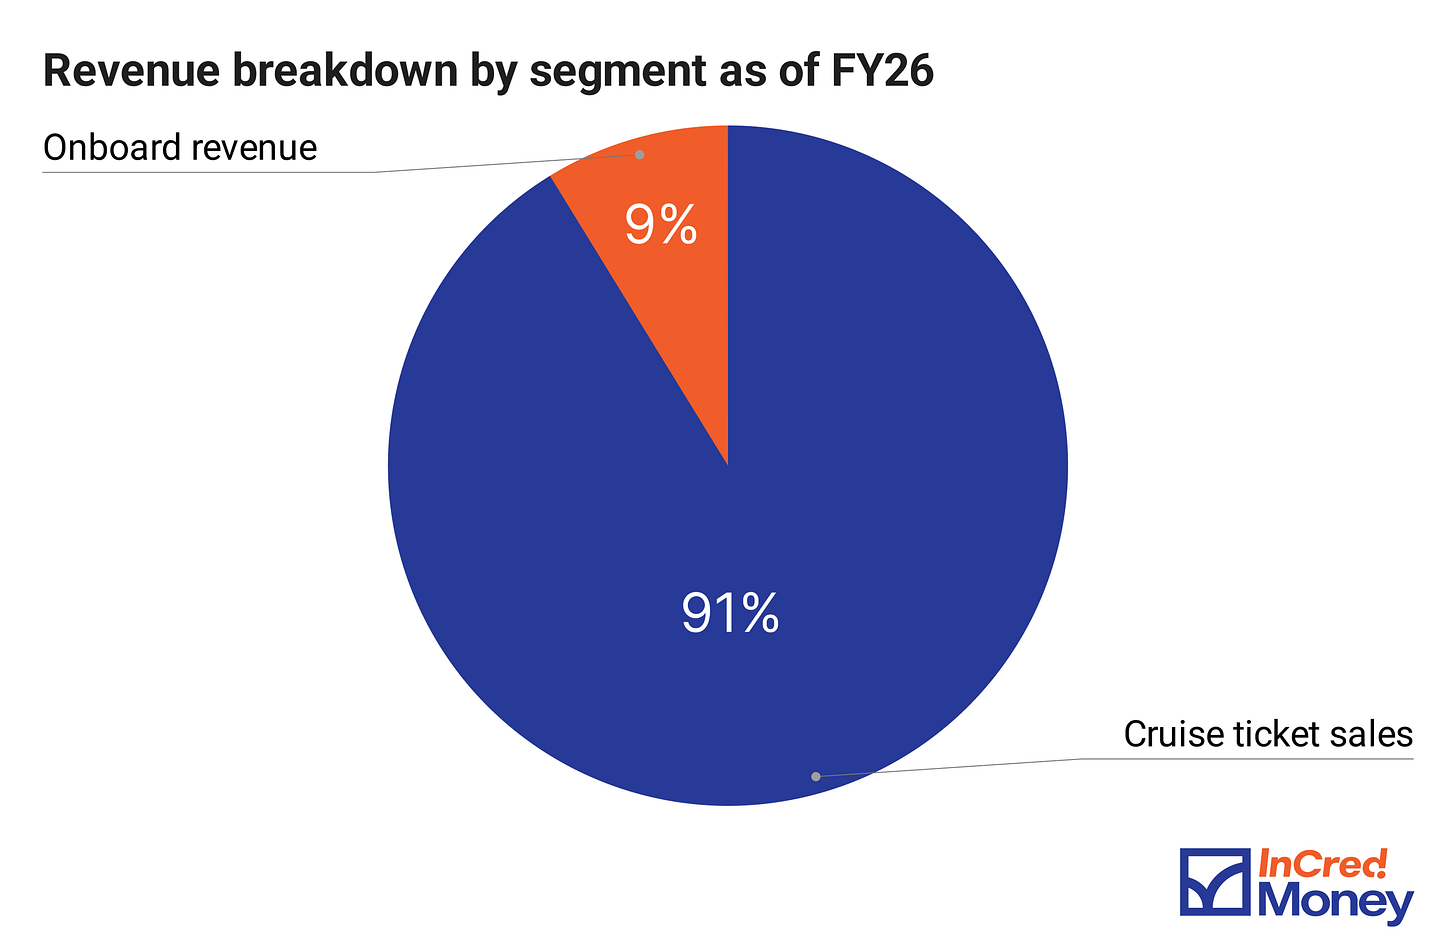
(Source: RHP)
- Cruise ticket sales cover the cabin, meals at the main restaurants (food court and Starlight), pool access, gym, and base entertainment. Revenue is recognised when the sailing completes.
- Onboard revenue covers specialty dining (Chopstix, International Grill), paid shows, spa, shore excursions, Wi-Fi, and gaming.
This split has stayed constant over the past three years.
Unit Economics (Per Passenger Cruise Day)
 “
“
(Source: RHP)
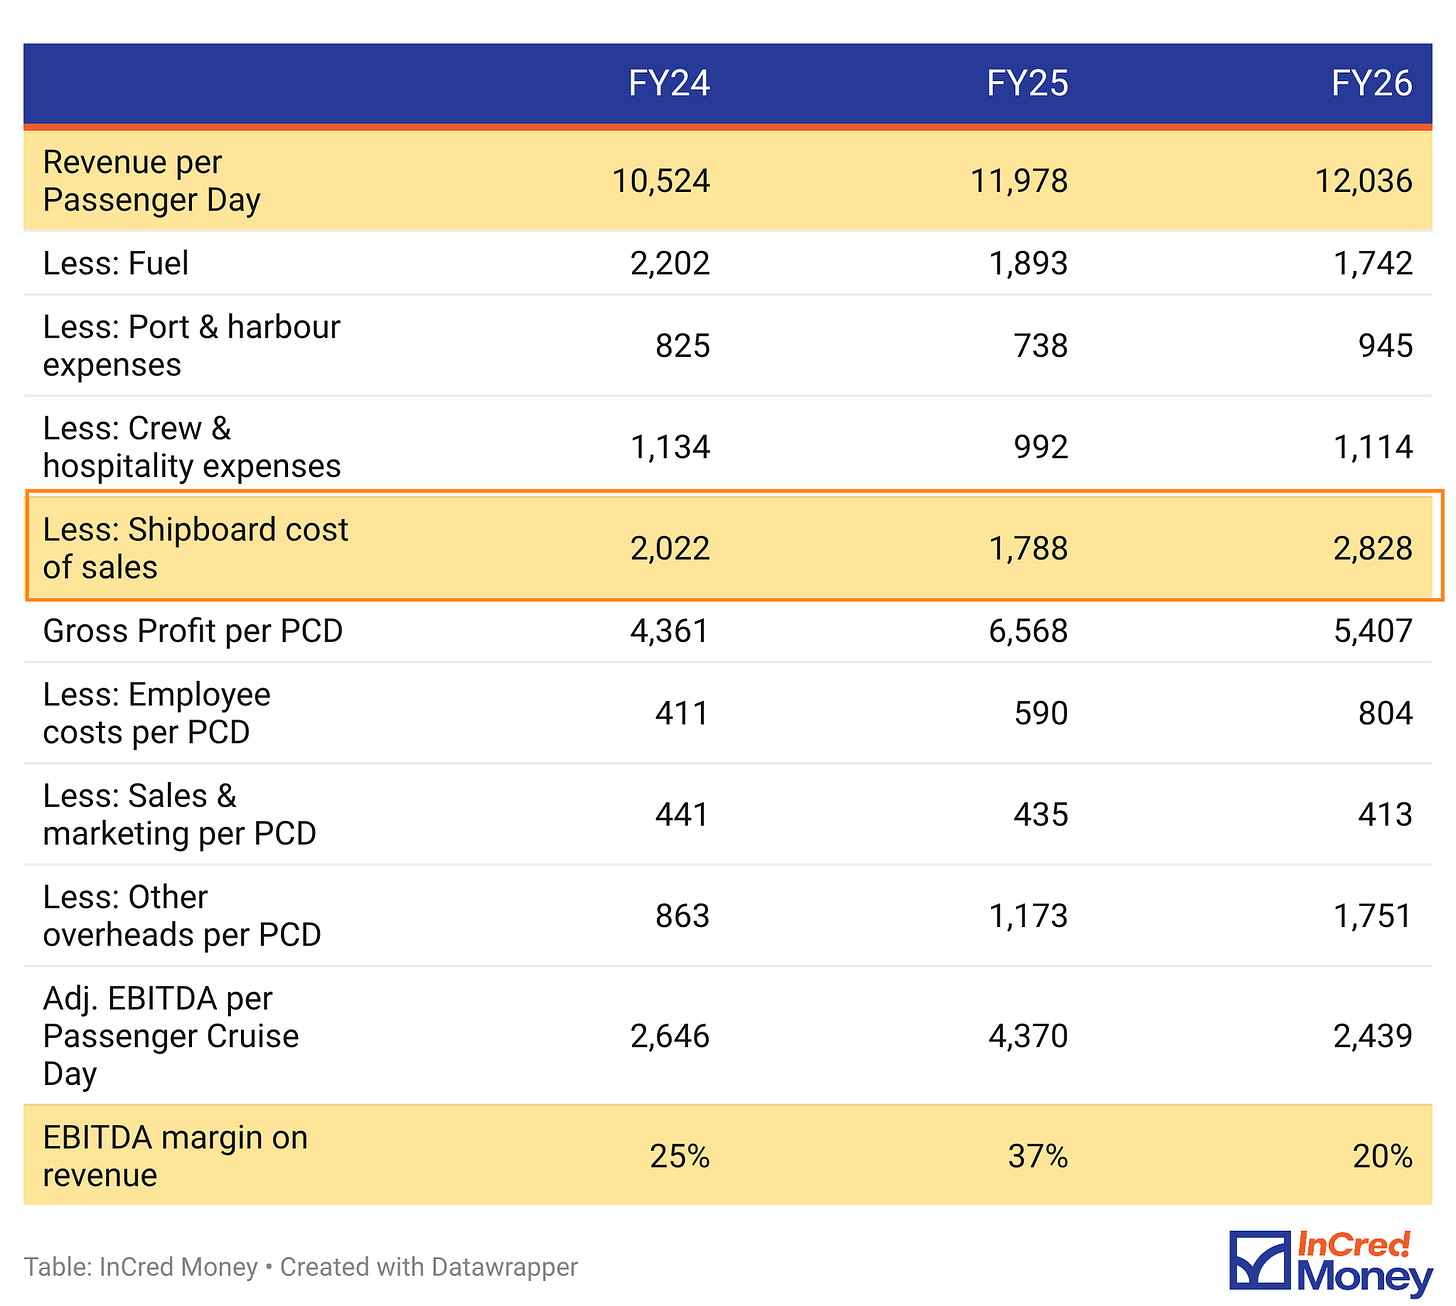
Per Passenger Cruise Day (PCD): A metric that breaks down total revenues or costs to show exactly what a single passenger generates or costs the company for one day on board.
While the raw numbers show fluctuating margins, digging into the unit economics reveals a business model with fundamentally strong demand:
Robust Top-Line Momentum: Revenue per Passenger Day has risen every single year, climbing from ₹10,524 to ₹12,036.
The FY26 Margin Compression Myth: At first glance, the drop in EBITDA margin from 36% to 20% looks alarming. However, this was primarily driven by a ~54.5% spike in Shipboard cost of sales, which was an accounting restructuring reflecting the inclusion of Campbell’s crew wages onto the books rather than a drop in operational efficiency.
Note: In February 2025, the company acquired the vessel-owning entity, Bay Cruise Investments Inc. (BCII), making it a wholly-owned subsidiary. Because of this consolidation, crew and technical management costs that were previously handled by the promoter and bundled into lease rentals were brought directly onto the company’s books
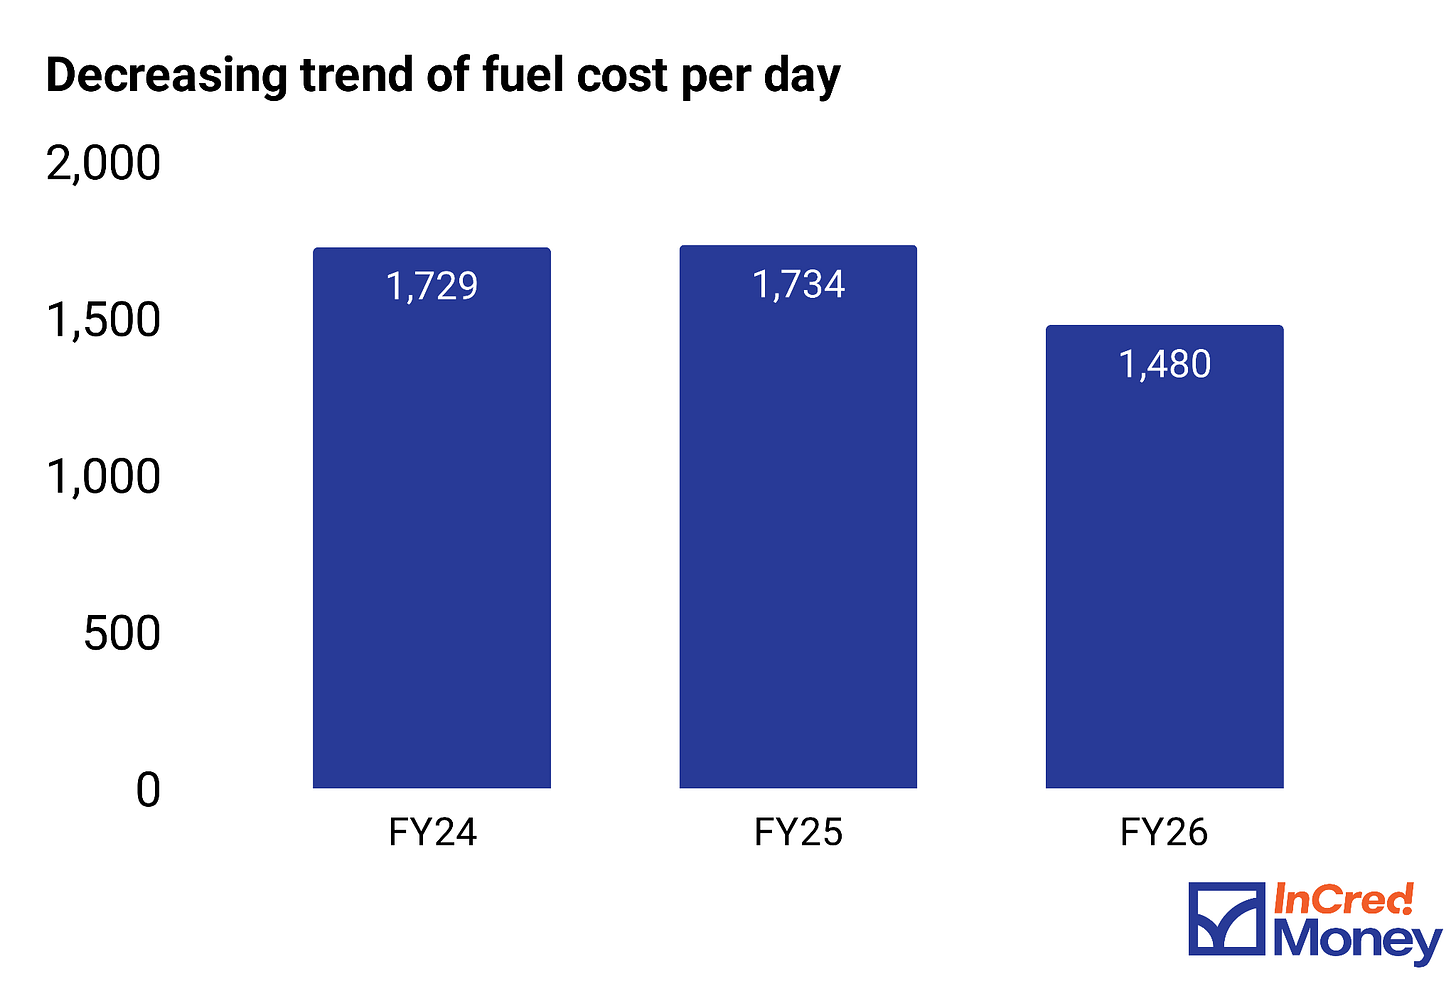
Hidden Efficiency Wins: Behind the scenes, core operational expenses are actually improving. Fuel costs per passenger day saw a significant drop in FY26, falling to ₹1,480 (down from ₹1,734 in the previous year), proving that route optimization and fuel efficiency are successfully protecting the company’s underlying baseline margins.
Operating Metrics and How They Are Moving
- Revenue per Passenger (APD) vs. Ticket Price: Driven by strong demand, average ticket prices rose to ₹10,979.8 by FY26 while total daily passenger spend hit ₹12,036.4. This widening gap highlights premium pricing power and a highly lucrative onboard upselling model (like spas and casinos).
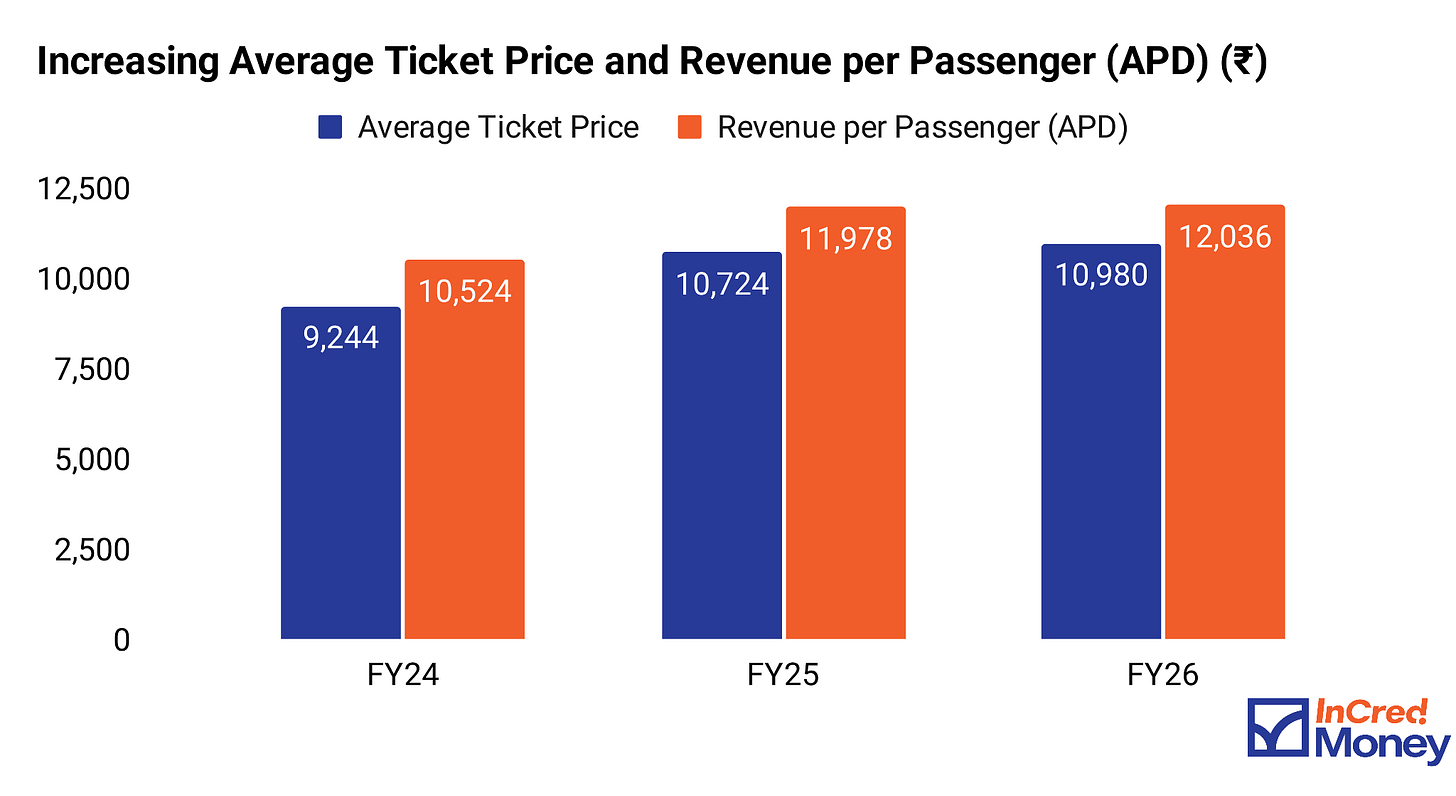
(Source: RHP)
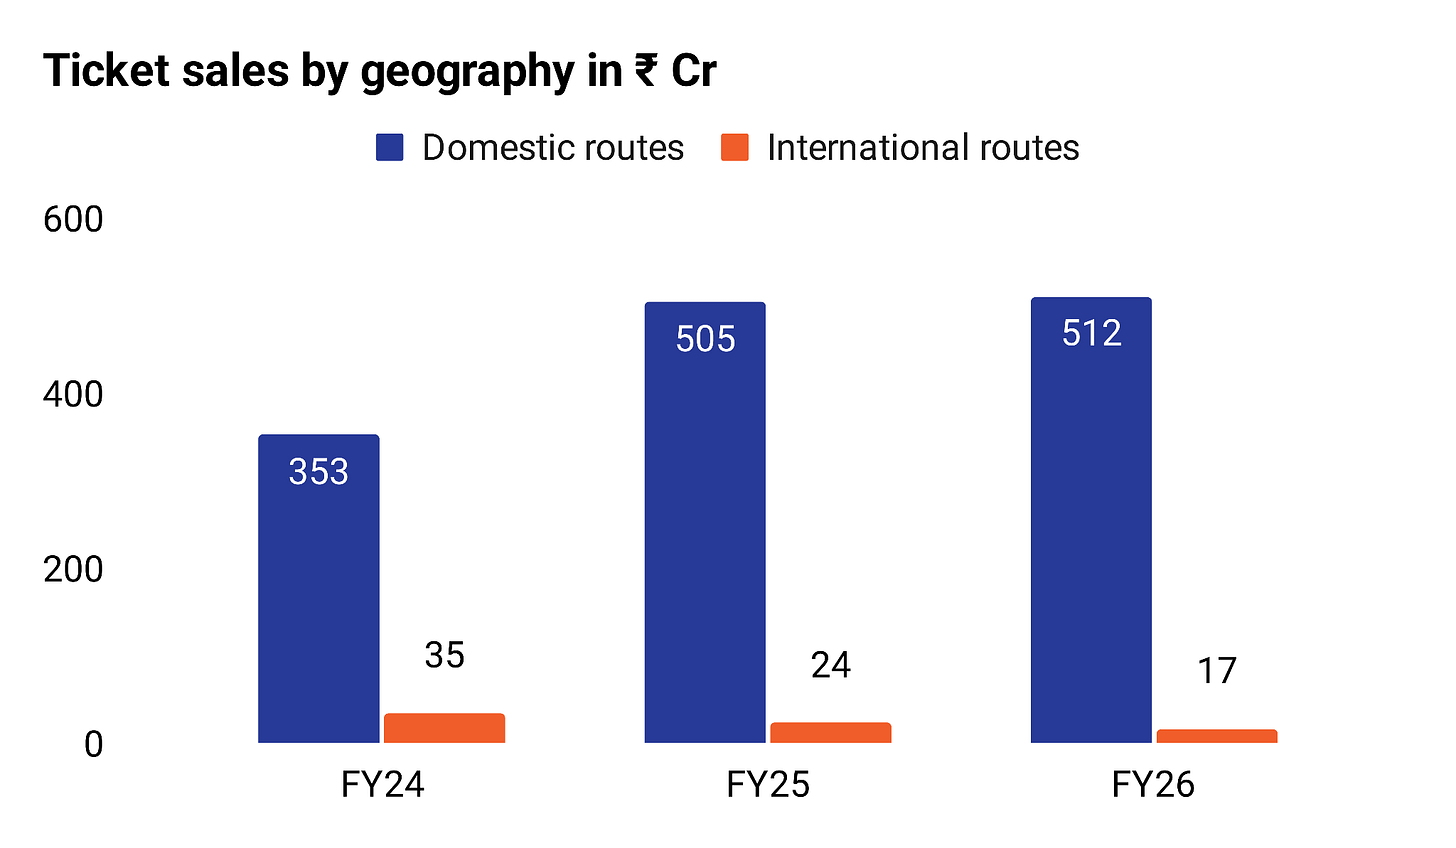
- International revenue is shrinking. International ticket revenue halved from ₹35.4 Cr in FY24 to ₹17.3 Cr in FY26, even as new routes were opened to Sri Lanka, Singapore, Malaysia and Thailand. Geopolitical headwinds and Middle East tensions hurt demand
(Source: RHP)
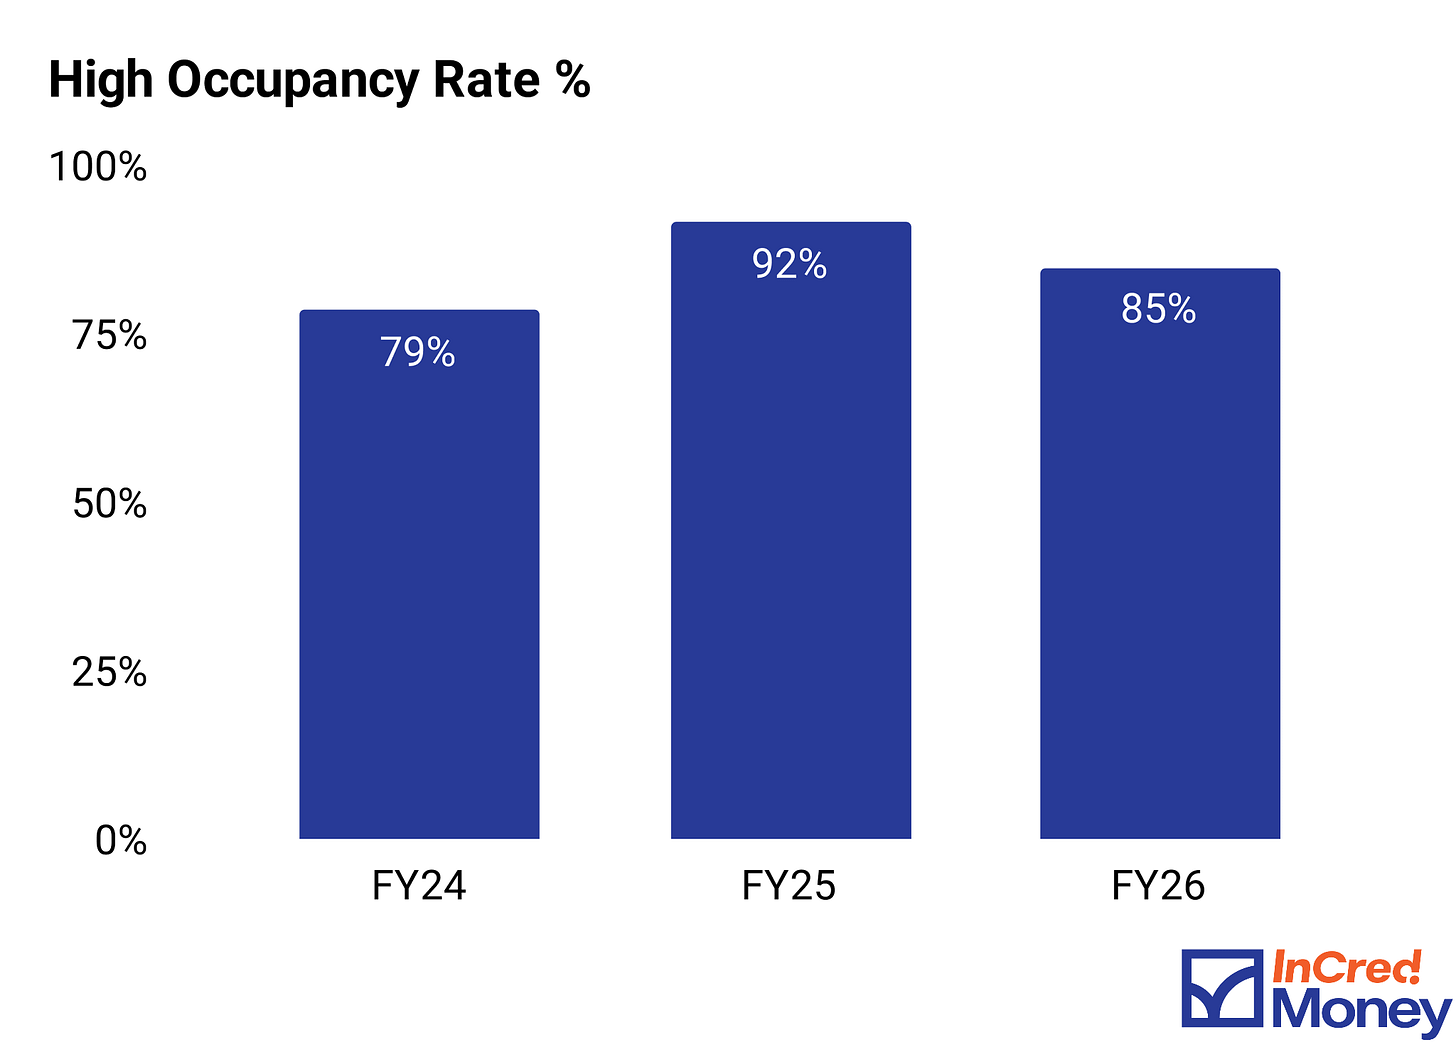
- Occupancy Rate: Occupancy surged from 79% to a peak of 92% before stabilizing at a strong 85% in FY26. This consistent high utilization proves rapid market capture and a healthy, sustainable balance between passenger volume and top-tier pricing.
(Source: RHP)
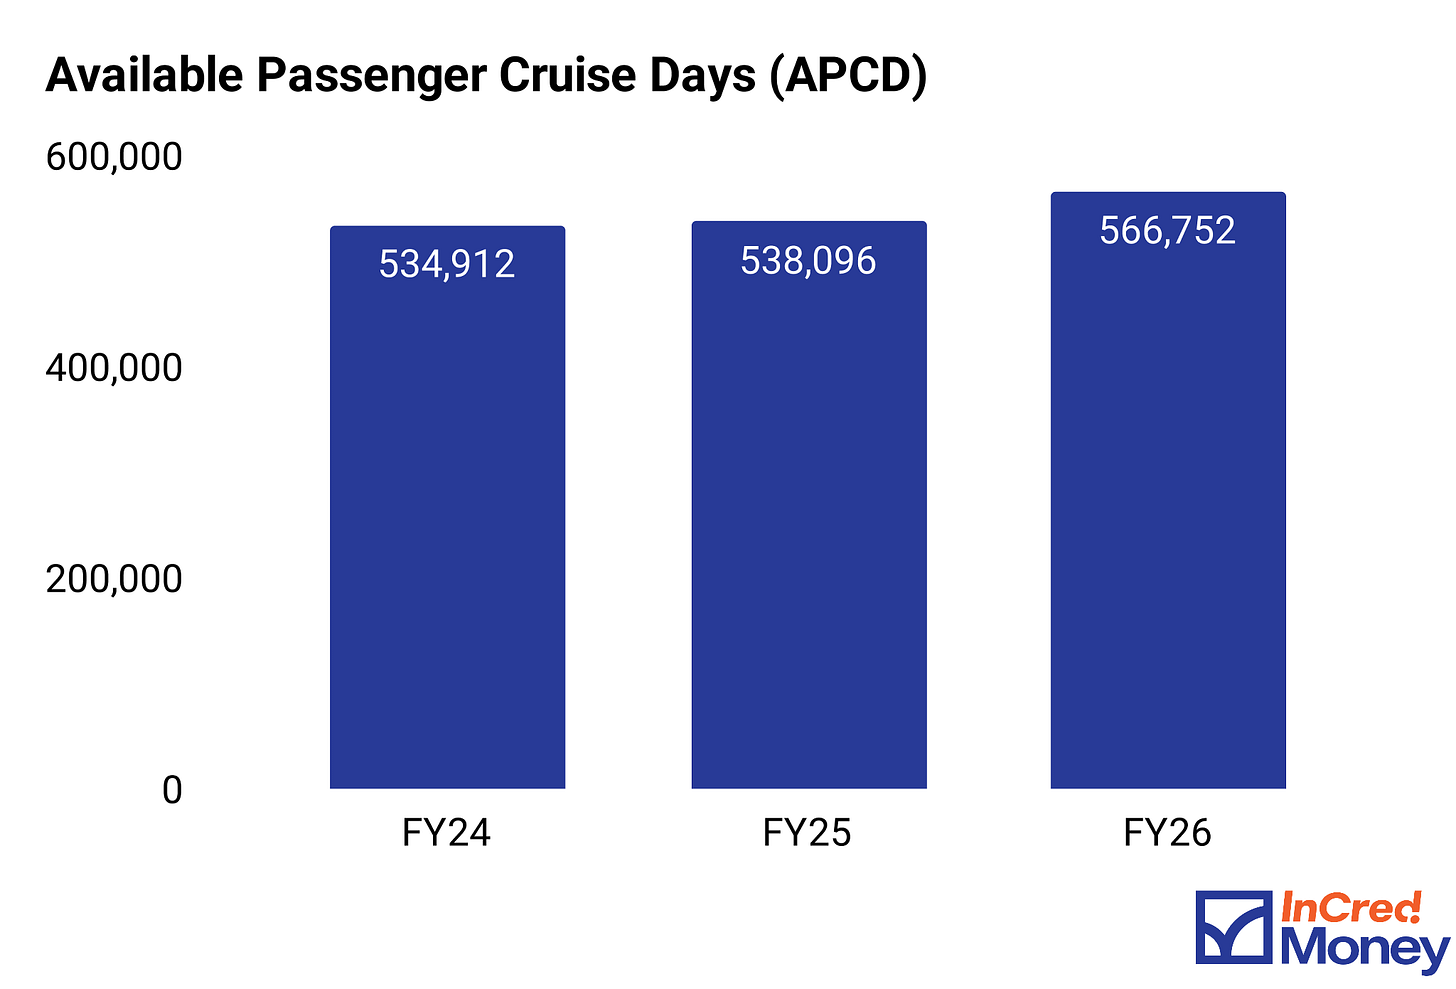
- Available Passenger Cruise Days (APCD): Total available cruise days expanded steadily from 534,912 to 566,752, despite the fleet remaining at just a single ship. This demonstrates operational efficiency, as management successfully reduced maintenance downtime to scale supply without buying a new vessel.
(Source: RHP)
Available Passenger Cruise Days (APCD): A metric representing the company’s maximum total capacity, calculated by multiplying the total number of available passenger beds by the number of days the fleet operated during the year.
- Fuel Cost per PCD: Fuel costs per passenger day dropped sharply by nearly 15% to ₹1,480 in FY26 after holding flat the previous two years despite ongoing geopolitical tensions. This efficient decline directly implies expanding net profit margins through optimized route planning or smart bulk-fuel hedging.
(Source: RHP)
What the Company Is Doing to Improve
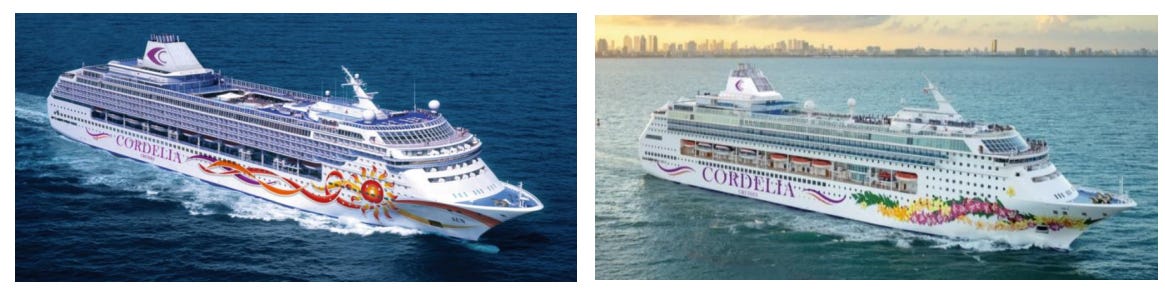
- Fleet tripling by FY28: They have entered into an agreement to acquire two new vessels on lease, namely ‘Norwegian Sky’ and ‘Norwegian Sun’. These ships together can accommodate ~4000 guests and ~2000 cabins
(Source: RHP)
- New routes in the pipeline: Colombo and Maldives routes from Kochi launch in October 2026. Planned expansion to Australia, UAE, Oman, Kuwait, Indonesia and Mauritius over the medium term. These require port approvals and bilateral arrangements which are not guaranteed.
From Revenue to the Bottom Line
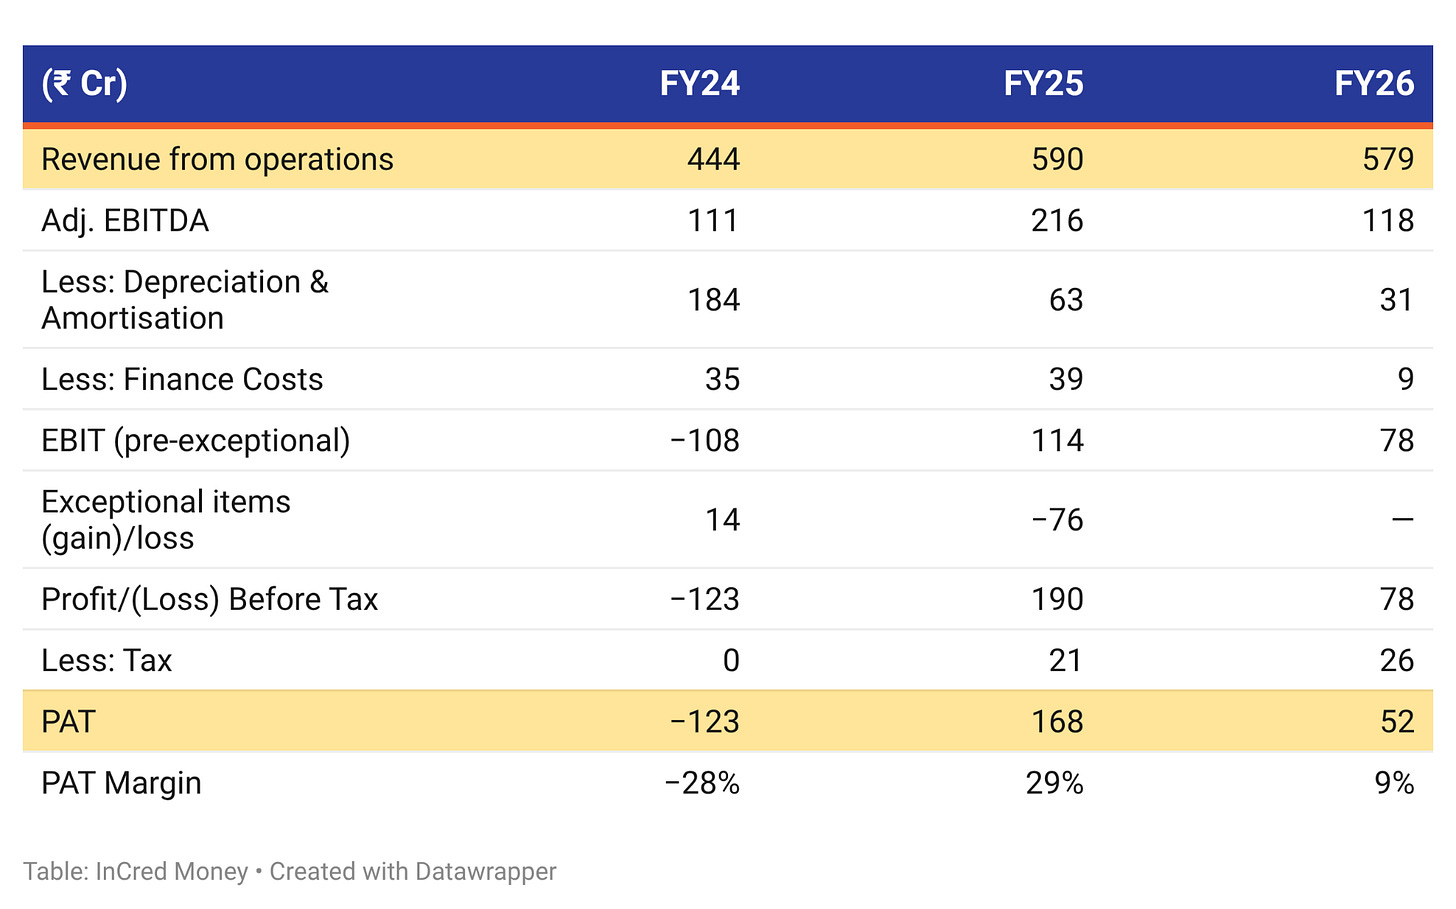
Two things to flag. First, FY25 PAT of ₹168 Cr includes a ₹75.6 Cr one-time exceptional gain from the lease derecognition when the promoter’s vessel agreement was terminated.
Strip that out and FY25 PAT was ₹93 Cr.
FY26 PAT stands at 52 Cr is lowered due their recent acquisition as all vessel-owning and crew-management expenses have been fully consolidated onto their books.
Valuation
(Source: RHP)
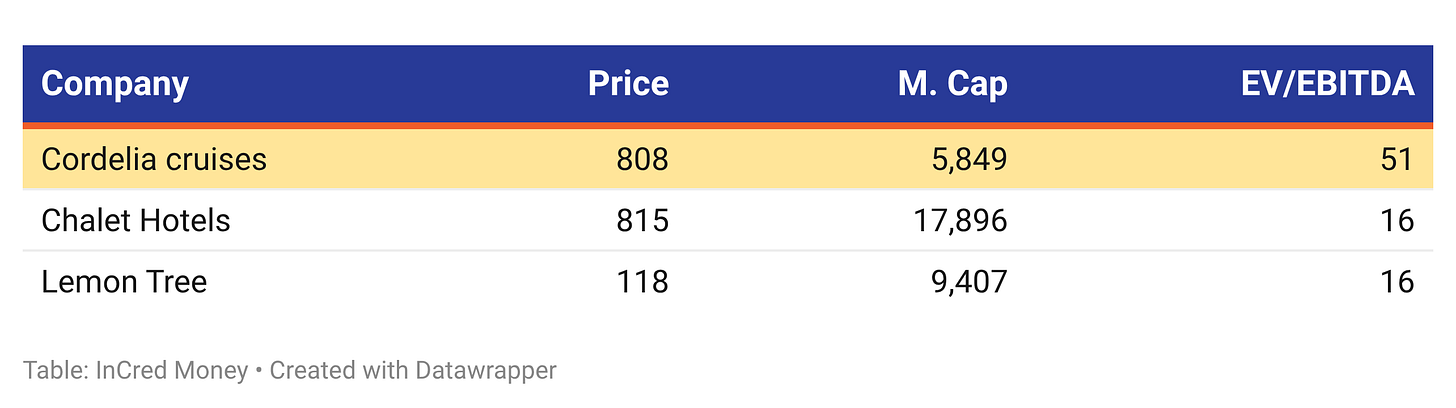
While there are no listed cruise companies and it cannot be compared on a ‘Peer-to-Peer’ basis to companies like Chalet or Lemon Tree. But for asset heavy businesses like cruises and hotels EV/EBITDA is a good measure to value a company relatively.
Based on FY26 data Cordelia Cruise seems overvalued compared to other companies.“`
Conclusion
Cordelia represents a fundamentally strong business with a dominant market position, but its long-term outlook depends heavily on the nature of its industry. Unlike essential utilities, a cruise line operates entirely within the premium leisure and tourism space.
While the company’s expansion strategy is highly ambitious, tripling capacity into a market where revenue depends on discretionary spends.
Ultimately, Cordelia’s post-IPO success will depend on its ability to sustainably stimulate luxury leisure demand to keep its new vessels highly utilized and operationally profitable.