IPO Summary

The Big Picture
Buying insurance in India is confusing. There are dozens of companies, hundreds of products, complicated terms. Most people don’t understand what they’re buying. And insurance companies struggle to reach customers in small towns because setting up physical offices and hiring trained agents everywhere is expensive.
But, the total addressable market for digital retail insurance distribution was ₹3 lakh Cr in FY25 and is projected to grow at ~12% CAGR to ₹5.3-5.8 lakh Cr by FY30.
Compared to mature markets having an average insurance penetration of 10.7%, India’s insurance penetration remains 71% lower at 3.1% signalling a massive headroom to grow. Alongside India’s insurance penetration is projected to exceed 4% by FY2030 driven by growing awareness and adoption of insurance products. In this context Turtlemint is coming up with its IPO!

The Business Model

The Core Engine: PoSP-Led Distribution
- The Tech: Partners use proprietary apps like Turtlemint Pro (India’s most downloaded insurance seller app) to onboard customers, compare quotes, and issue policies instantly.
- The Training: Turtlemint Academy handles digital training and certification, turning everyday individuals into micro-entrepreneurs to equip them with right skills to be digital partners.
The Growth Strategy: Deep-Tier Penetration
- Targeting B30+: Over 80% of Turtlemint’s partners operate in cities beyond India’s top 30 cities, known as “B30+” market.
- The Trust Factor: In these markets, customers want the speed that digital networks provide, but still demand a local, human face they can trust to guide them.
The B2B Multiplier: Turtlefin
It allows banks, fintechs, and e-commerce platforms to plug insurance products directly into their own systems and tap into Turtlemint’s certified training infrastructure.
This matters because Turtlefin can generate revenue without relying on a PoSP network, as IRDAI’s mandate for banks to offer multi-insurer ecosystem is a regulatory tailwind.
How Turtlemint Makes Money
Turtlemint is completely free for end customers. It generates revenue through two main B2B streams:

Operational KPIs
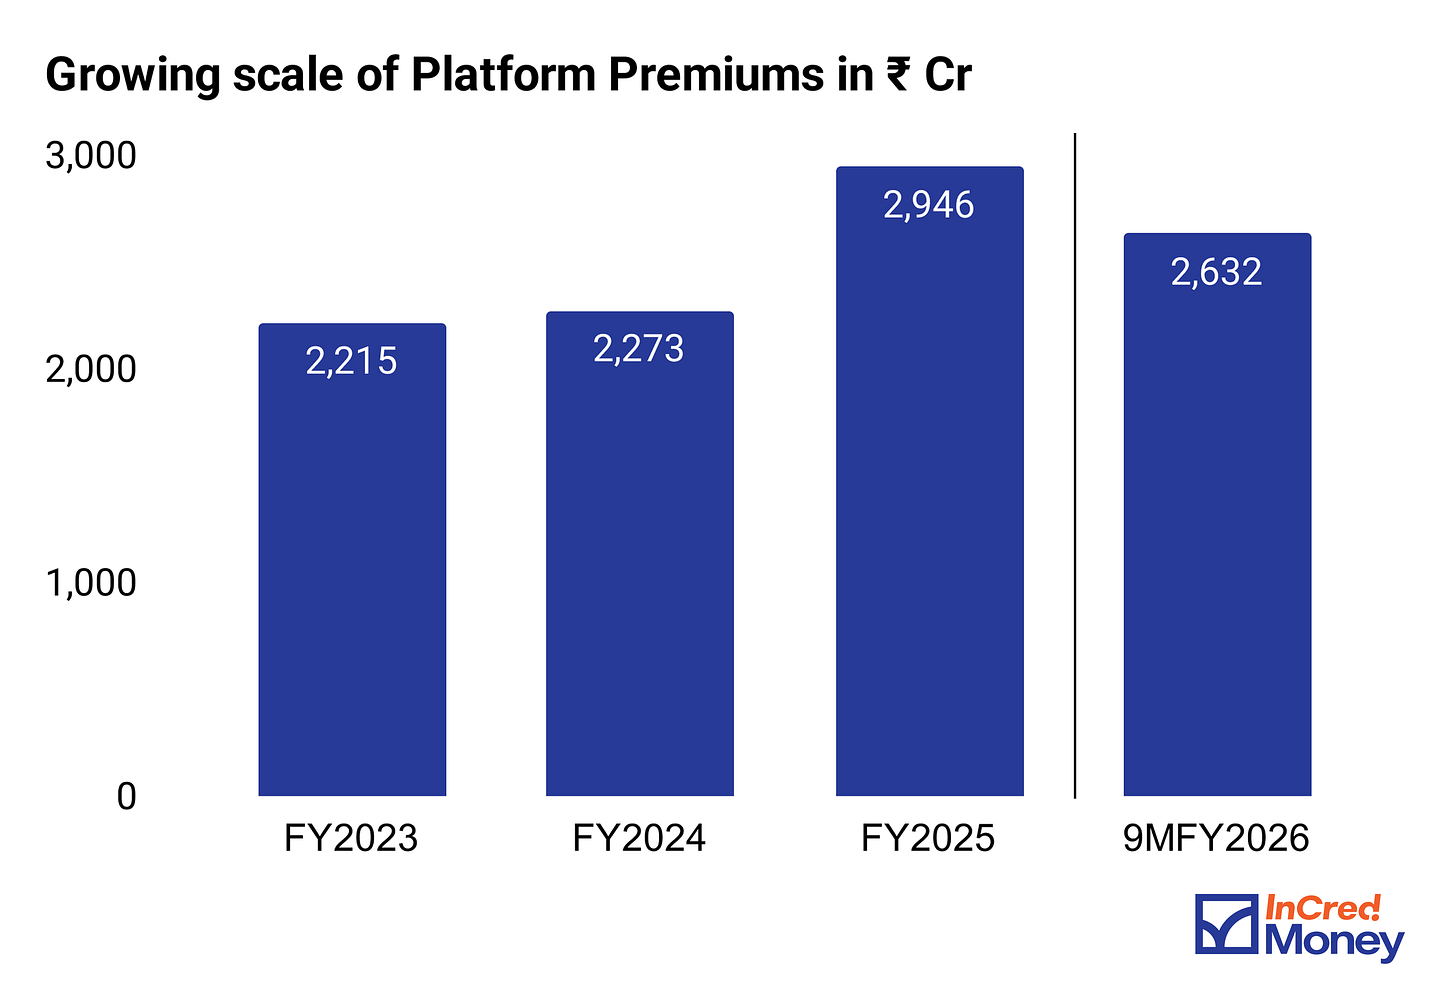
- Platform Premium: This represents the total actual premium, paid by customers to the insurance companies for policies that were issued or renewed through the platform.

- Percentage of Platform Premium distributed in B30+ markets: This measures the proportion of the total Platform Premium that originates from pin codes located in B30+ markets, which are cities and towns beyond India’s top 30 most populated cities. Growing consistently from 71.64% in FY23 to over 75% in 9M FY26, this KPI validates the company’s core mission: deepening financial penetration in underserved, semi-urban, and rural areas.

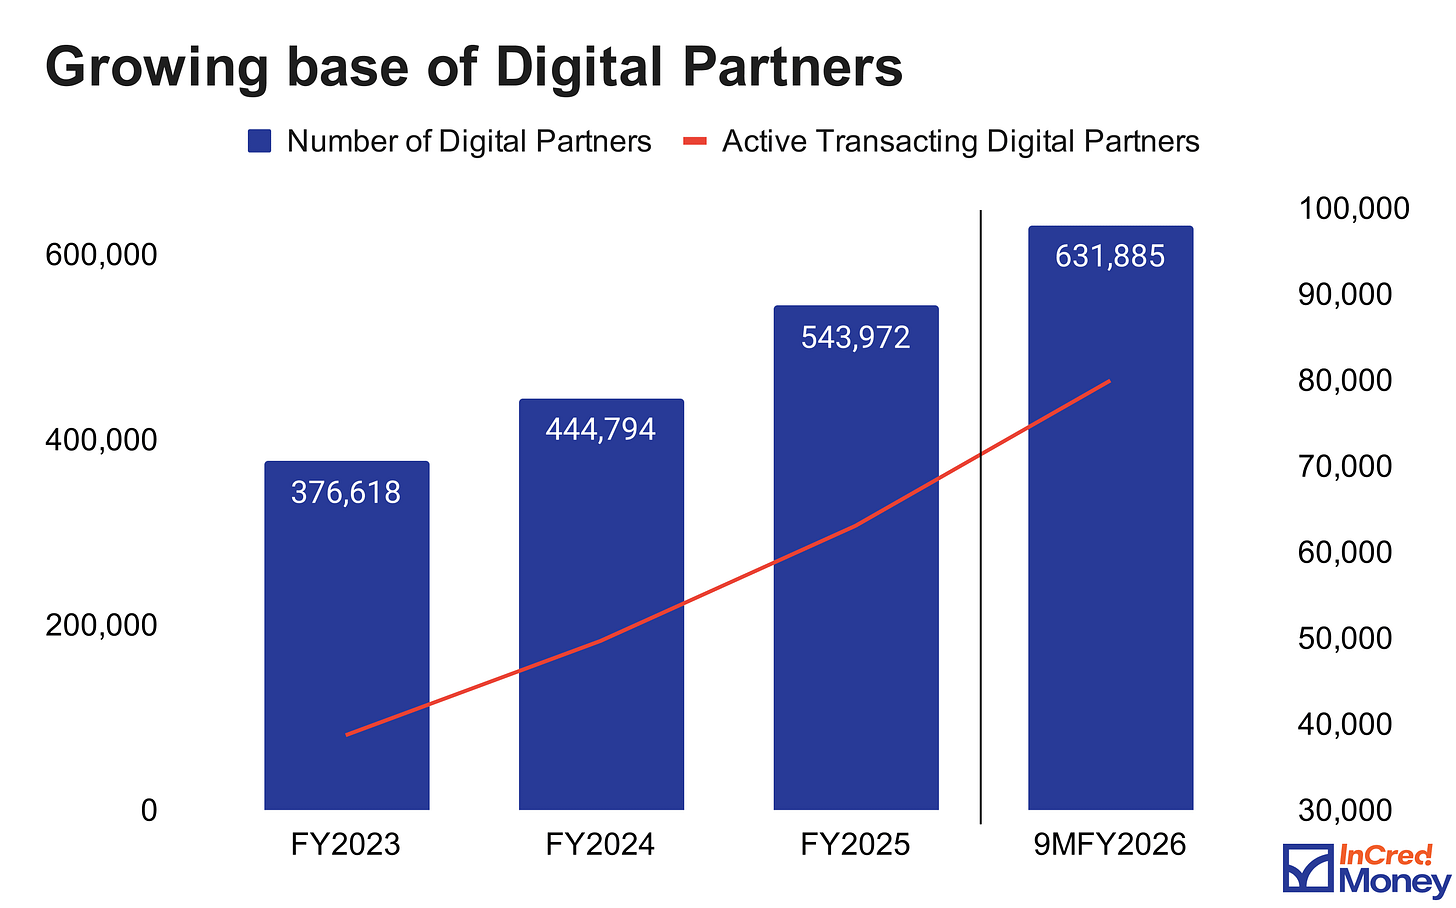
- Number of Digital Partners: Between FY23 and 9M FY26, the total pool of Digital Partners expanded by 68% (growing from 3.76 lakh to over 6.31 lakh). However, the number of Active Transacting Partners outpaced this expansion entirely—surging by 107% to reach 79,943. Because active engagement is growing faster than overall sign-ups, Turtlemint’s Network Activation Rate has steadily climbed every single year.

Peer Comparison (9MFY26)

Though business models of Turtlemint and PB Fintech are not comparable. PB fintech is its closest listed peer.
Operational & Network Edge: Turtlemint holds a clear first-mover advantage by adopting the PoSP model in 2015 (versus PB Fintech in 2021), enabling it to command a larger certified network of over 507,000 PoSPs compared to PB Fintech’s ~400,000 as of December 31, 2025.
Massive Financial Scale: PB Fintech operates at a vastly larger volume, generating ₹20,717 Cr in platform premium and ₹4,732 Cr in operating revenues during 9M FY26 — which is roughly 6.4 times higher than Turtlemint’s revenue.
Profitability Divergence: PB Fintech has been profitable since FY24 and recorded a net profit of ₹408.97 Cr in 9M FY26. In contrast, Turtlemint remains in a loss-making phase, posting a net loss of ₹187.39 Cr during the same period.
Accelerated Growth Rate: Despite its smaller financial base, Turtlemint is expanding its top-line much faster, capturing an 80.28% period-on-period growth in operating revenue for 9M FY26, significantly outpacing PB Fintech’s 36.41% growth rate.
Financial Analysis

Note: In FY23 and FY24 53% to ~88% of their of their revenue came from marketing fees respectively. Later, due to regulatory headwinds related to insurance marketing, they had to switch their model, which explains the dip in FY24 numbers.
• Revenue from operations has increased 58% from 420 Cr in FY23 to 663 Cr in FY25. Furthermore, its revenue for the first nine months of FY26 is nearly 12% higher than the figure for FY25.
• The company has never reported a profit: 9MFY26 loss of ₹187 Cr includes ₹52.5 Cr of exceptional items. Underlying operating loss is closer to ₹135 Cr. Losses are shrinking but PAT-positive is an FY27-28 question, not an FY26 one.
• No financial debt. Only lease liabilities of ₹30.9 Cr total. Finance costs in 9M FY26 were ₹1.6 Cr. The balance sheet is clean!
Risk Analysis
• Top insurer partner = 15% of revenues: A single undisclosed insurer contributed 15% of revenues in 9M FY26. Top 10 contributed 72.5%. If one major insurer pulls back on volume, Turtlemint has no natural hedge — it materially impacts its bottom line.
• PoSP model risk: Many Digital Partners treat insurance as part-time income. Permanent employee attrition was 48.5% in FY24 and 24.2% in 9M FY26. If DP churn runs at similar rates, the cost of continuous recruitment and re-certification absorbs most of the leverage the network is supposed to generate.
Valuation


Conclusion
Turtlemint is interesting because the B30+ positioning is real!
Turtlemint offers a distinct “phygital” approach to insurance distribution, supported by an expanding partner network and strong penetration in underserved B30+ regional markets.
While the company’s rapid top-line expansion and operational scale are evident, it remains in a loss-making phase.
Ultimately, the company’s long-term performance will depend on its ability to sustain this growth momentum, stabilize high partner attrition rates, and successfully transition its scale into consistent net profitability.